Figures & data
Table 1. Oligonucleotide sequences and product sizes of primers.
Figure 1. The structure and components of acellular nerves. In the cross-sections of ANA and ANX, chromotropic acid 2R-brilliant green staining showed that the endoneurial tubes were apparently hollow and the structural integrity of the basal lamina tubes was well retained. There was little red residual debris of myelin sheath in the remaining vessels of basilar membrane (A, B). SEM further revealed that the cells, axons, and myelin sheath were absent, and the orderly arranged basal lamina tubes were remained, as presented as the mesh-like structure in the transections (C, D). Immunostaining confi rmed that laminin was largely preserved (E, F), while S100-positive Schwann cells were completely eliminated in both biomaterials (G, H). Scale bar = 10 μm.
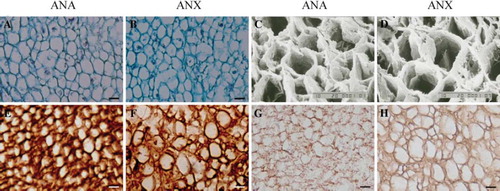
Figure 2. Immunological reaction elicited by ANA or ANX following subcutaneous implantation. H&E staining at 1 and 2 weeks post-implantation (A, B, E, and F). Immunostaining showed that a minority of CD3-positive T lymphocytes infiltrated in the grafts and host tissues after 1 week (C, D), and CD3 expression of the infiltrated T lymphocytes were reduced markedly after 2 weeks (G, H). Scale bar = 20 μm.
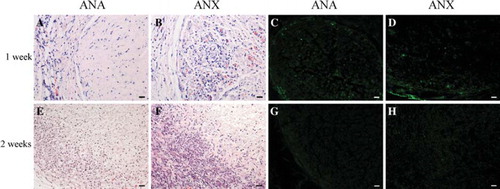
Figure 3. Morphological characteristics and mesodermal differentiation of the cultured BMSCs. The primary BMSCs exhibited spindle-shaped morphology at day 7 and morphological homogenicity when cells reached 85% confluence at day 12 (A, B, phase contrast). After differentiation in vitro for 3 weeks, calcium deposits in the cytoplasm were detected via alizarin red staining © and intracellular lipid globules were visualized via Oil Red O staining (D). Scale bar = 20 μm (A, B), 50 μm (C, D).
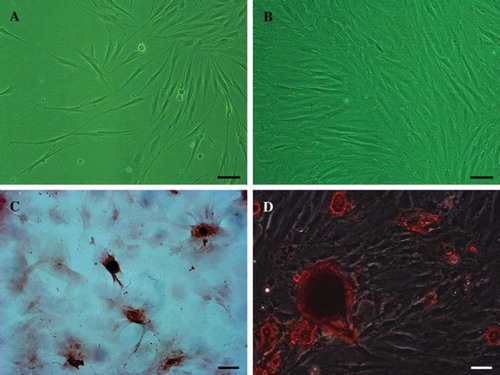
Figure 4. MTT assay of BMSCs activity at a range of incubation time points after cells were cultured with the leaching liquor of either ANA or ANX (mean ± SD, n = 5).
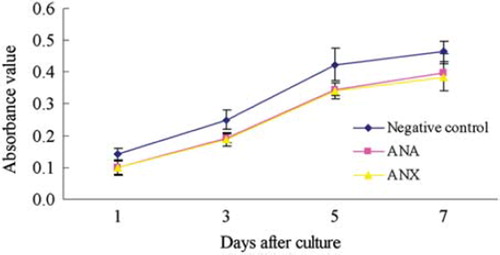
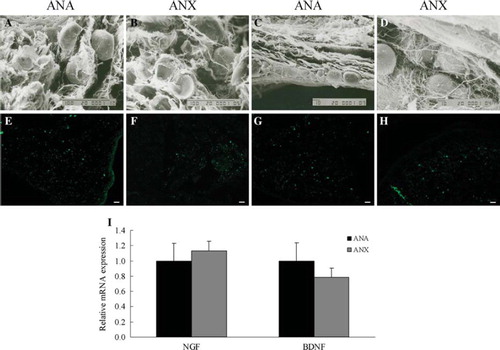
Figure 5. SEM observation of the cross- and longitudinal sections of BMSCs-laden nerve scaffolds after 5 days culture in vitro (A-D). NGF (E, F) and BDNF (G, H) expression in the constructed nerve grafts by immunostaining. The mRNA expression of the neurotrophic factors determined by real-time PCR (I). β-actin was used as the control housekeeping gene and the mRNA expression was calculated by the 2-ΔΔCT method (mean ± SD, n = 4). The relative mRNA levels were represented as the ratios by comparing the expression of each group with that of the ANA group (designated as 1). Scale bar = 100 μm (A, B), 10 μm (C, D), 20 μm (E–H).