Figures & data
Figure 1. Schematic diagram of a buffer and bus networks: (a) a PANDA ring resonator; (b) a wavelength router and bus networks, where Radd is the add/drop filter radius, RR and RL are the right and left ring resonator radii, respectively.
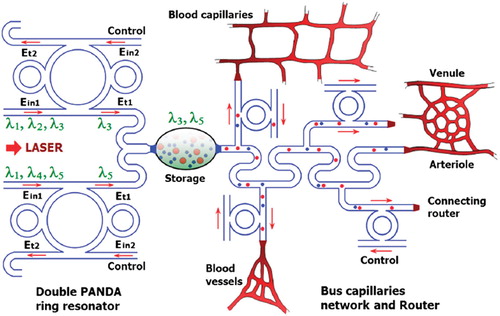
Figure 2. Schematic of molecular buffer work in core waveguide.
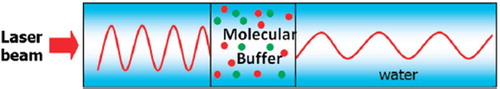
Figure 3. Graph of optical power that is required to trap the particle of a certain size/polarizibility.
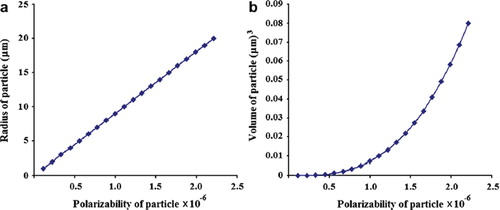
Figure 4. Result of the dynamic tweezers with different (a) wavelengths and (b) tunable tweezer by coupling constants, where Radd = 20 μm, RR = RL = 5 μm.
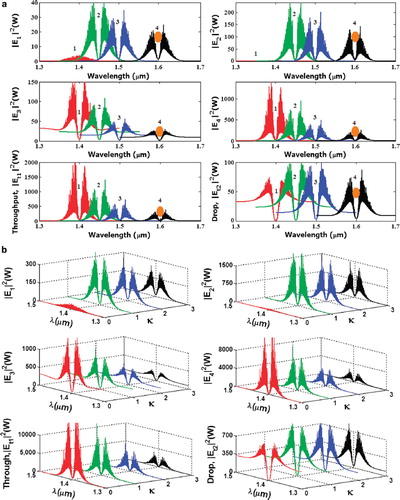
Figure 5. Results of the trapping tools: (a) and (b) different sizes and wavelengths; (c) tweezers separation; (d) normalized tweezers, where Radd = 20 µm, RR = RL = 5 µm. The coupling coefficients are κ0 = 0.5, κ1 = 0.35, κ2 = 0.1 and κ3 = 0. 35. The input power is 1W, Radd = 20 µm, RL = Rr = 5 µm: (a) wavelength = 400 nm; (b) wavelength = 450 nm; (c) wavelengths = 400, 450 nm; (d) wavelengths = 400, 600 nm.
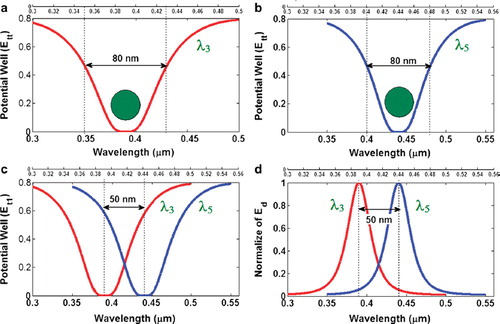
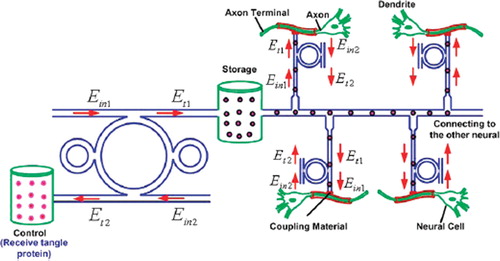
Figure 6. Schematic diagram of molecular bus network.