Figures & data
Figure 1. Schematic representation of the semi-continuous colon model fermentation system derived from the computer-controlled human dynamic gastrointestinal tract [Citation16]. The fermentor is continuously magnetically stirred. Temperature of the culture system is kept constant at 37 °C by the flow of hot water in the double-jacketed vessel. pH is computer controlled at 6.4. Portholes allow for the addition of food solution and the removal of the culture solution. Anaerobic atmosphere is maintained by the flush of nitrogen.
![Figure 1. Schematic representation of the semi-continuous colon model fermentation system derived from the computer-controlled human dynamic gastrointestinal tract [Citation16]. The fermentor is continuously magnetically stirred. Temperature of the culture system is kept constant at 37 °C by the flow of hot water in the double-jacketed vessel. pH is computer controlled at 6.4. Portholes allow for the addition of food solution and the removal of the culture solution. Anaerobic atmosphere is maintained by the flush of nitrogen.](/cms/asset/980da095-3f0e-44a4-ba90-638051b36277/ianb19_a_622280_f0001_b.jpg)
Table 1. Retention time during fermentation 1, 2, and 3 as determined by operating parameters.
Table 2. PCR primers used to analyze Bifidobacteria, Lactobacilli, and total bacteria.
Table 3. Comparison of the cell viability of Lactobacilli and Bifidobacteria in the presence of other intestinal bacterial groups during fermentation 1 (Rt = 72 h), 2 (Rt = 96 h), and 3 (Rt = 144 h) to available human colon data. Mean log viable count and standard deviation were calculated from plate counts between day 0 and day 35. Clinical data are presented as the range of the average composition of the adult ecosystem [Citation9]
Figure 2. Percentage bacterial cell variability, computed as the variation coefficient calculated from plate counts, of Lactobacilli (A) and Bifidobacteria (B) during fermentation 1 (Rt : 72 h), 2 (Rt : 96 h), and 3 (Rt : 144 h) between day 0 and day 5, 10, 15, 25, and 35.
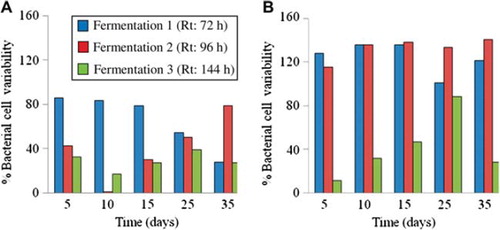
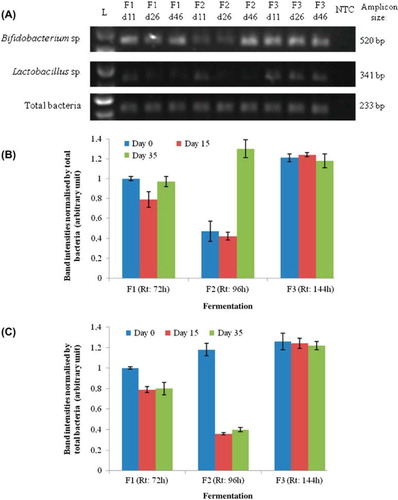
Figure 3. PCR analysis of the inoculum samples per group analyzed (Bifidobacteria, Lactobacilli and total bacteria) and fermentation 1 (Rt: 72 h), 2 (Rt: 96 h), and 3 (Rt: 144 h) on days 0, 15, and 35 (A). Abbreviations: L - Ladder; NTC - Non template control. The graphs (B: Bifidobacteria and C: Lactobacilli) are the semi-quantitative representation of the band intensities PCR products as analyzed by Image J software. The band intensities of the PCR products were normalized by that of total bacteria. The band intensities of Fermentation 1 on day 0 have been taken as 1, and the other band intensity values were represented relative to that. Data represent the means ± SD (n = 3).