Figures & data
Figure 1. Scanning electron microscopic images of the nanofibers using polymer concentrations of: (a) 13% w/v; (b) 10 %w/v; (c) 8 % w/v.
Table 1. Optimized conditions of nanofiber.
Figure 2. FTIR spectra of Diclofenac, showing drug-loaded nanofiber and plain polymer, respectively, from the bottom.
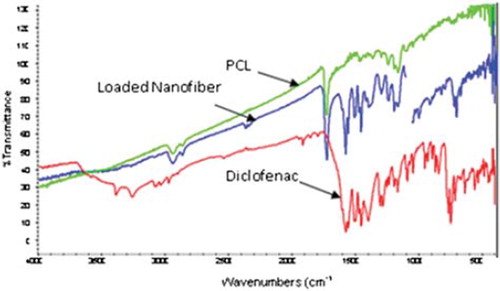
Table 2. Loading capacity of different formulation at different drug concentrations.
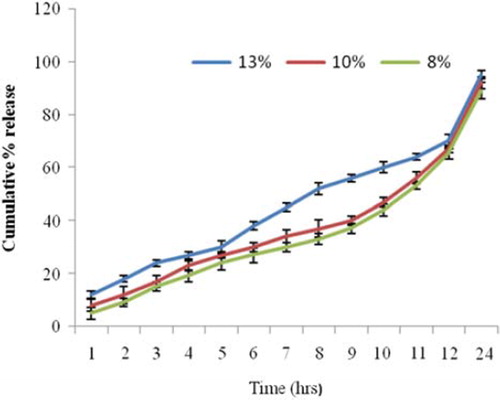
Figure 3. Drug release profile from different PCL formulations.