Figures & data
Figure 1. HE stained (A) trypsin, (B) osmotic, (C) trypsin-osmotic, (D) detergent-osmotic decellularized, and (E) control leaflets. Cells were mostly detectable in the fibrosa and ventricularis of trypsin treated valves (A). Osmotic (B) and detergent-osmotic (D) treatment did not remove any cells from the valves when compared to controls. Trypsin-osmotic decellularization (C) resulted in an almost completely acellular matrix. Only a few interstitial cells are present. Scale bar 50μm.
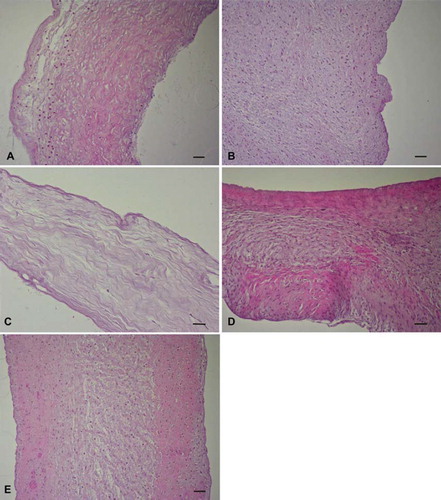
Figure 2. Russel-Movat pentachrome staining of (A) trypsin, (B) osmotic, (C) trypsin-osmotic, (D) detergent-osmotic, and (E) control leaflets. The three-layered structure of the leaflets was preserved in all matrices except those of (A) trypsin and (C) trypsin-osmotic treatments. Trypsin-based treatments resulted in a significant loss of collagen. No elastic fibers or GAGs were detectable. Scale bar 50μm.
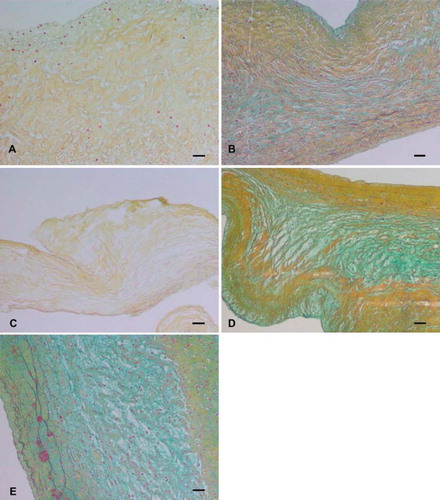
Figure 3. Transmission electron microscopic images of (A) trypsin, (B) osmotic, (C) trypsin-osmotic, (D) detergent-osmotic decellularized, and (E) control leaflets. In trypsin (A) and trypsin-osmotic (C) matrices, tightly packed and aligned collagen fibres are absent. Collagen fibres of detergent-osmotic matrices (D) show a decreased density. The collagen structure of the osmotic treated valves (B) is well preserved compared to controls (E). Scale bar 500nm.
Figure 4. Transmission electron microscopic images of (A) trypsin, (B) osmotic, (C) trypsin-osmotic, (D) detergent-osmotic decellularized, and (E) control leaflets. (A) shows some remnants of GAGs. In osmotic matrices (B) GAGs are well preserved and closely associated with collagen fibres compared to controls (E). Detergent-osmotic matrices (D) show GAG preservation, but less association with collagen fibres. A complete loss of GAGs is present in trypsin-osmotic leaflets (C). Scale bar 500nm.
Figure 5. Work to maximum load (kJ) of trypsin, osmotic, trypsin-osmotic, and detergent-osmotic decellularized leaflets.
Figure 6. Immunohistochemical CD3+ T-cell staining seven days after implantation of (A) trypsin, (B) osmotic, (C) trypsin-osmotic, (D) detergent-osmotic treated matrices. Trypsin (A) and trypsin-osmotisc matrices (C) show a strong inflammatory infiltration. Osmotic leaflets (B) show a milder inflammatory response. Only a few CD3 + T-cells are present in detergent-osmotic matrices (D). Scale bar 100μm.
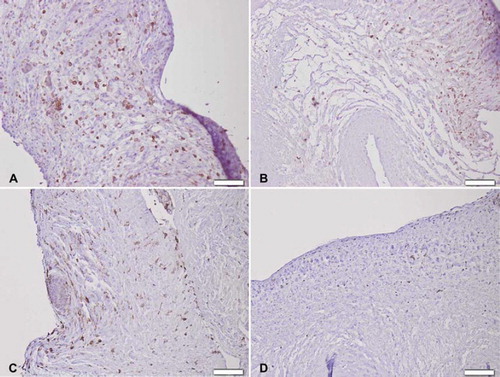
Figure 7. Immunohistochemical CD8 + T lymphocyte staining seven days after implantation of (A) trypsin, (B) osmotic, (C) trypsin-osmotic, and (D) detergent-osmotic treated matrices. Only trypsin (A) and detergent-osmotic matrices (D) show some CD8 + T-lymphocytic infiltration. Scale bar 100μm.
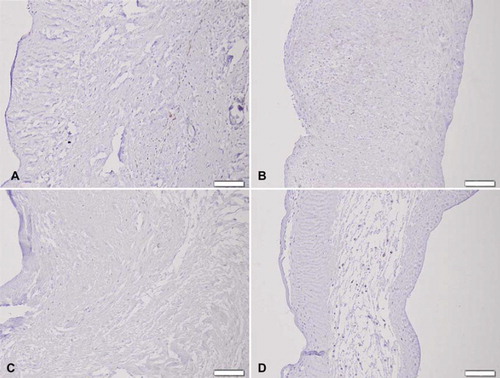
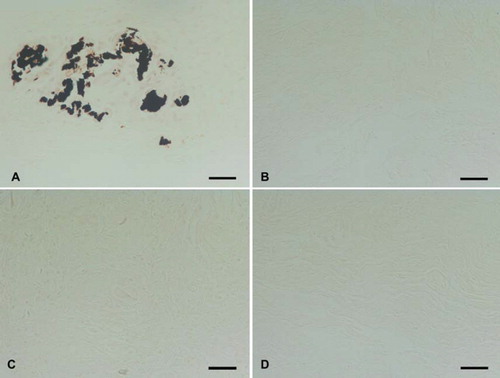
Figure 8. Von Kossa staining of (A) trypsin, (B) osmotic, (C) trypsin-osmotic, and (D) detergent-osmotic treated matrices seven days after implantation. Calcific deposits are only present in trypsin matrices (A), as indicated by black staining. Scale bar 100μm.