Figures & data
Figure 1. Schematic diagram of the electrospinning system.
Figure 2. PLGA-SF NCs just after implantation (A) and six weeks after implantation (B).
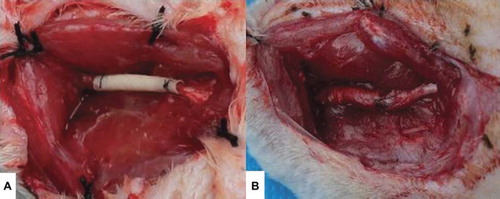
Figure 3. Macroscopic image of PLGA-SF NCs.
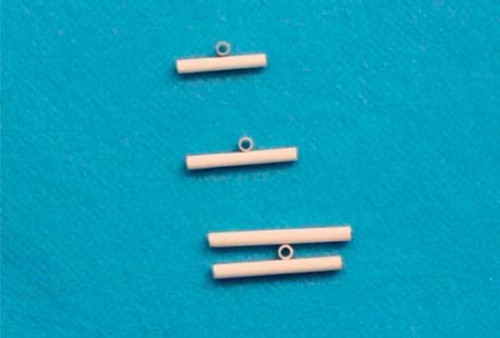
Table 1. Mean diameter of nanofiber under different distance and rotating velocity.
Figure 4. SEM of nanofibers from PLGA-SF NCs prepared at a distance of 10 cm. Note the high numbers of droplets and beads.
Figure 5. SEM of nanofibers from PLGA-SF NCs prepared at a throw distance of 15 cm and rotational velocity of 1000 r/min. Note the fraction of nanofibers aligned in sequence.
Figure 6. SEM of nanofibers from PLGA-SF NCs prepared at a throw distance of 15 cm and rotational velocity of 1500 r/min. The nanofibers show an orderly alignment and good orientation.
Figure 7. SEM of nanofibers from PLGA-SF NCs prepared at a throw distance of 15 cm and rotational velocity of 2000 r/min. Nanofibers exhibit an orderly alignment and good orientation, but a number of nanofibers are broken.
Figure 8. Cross-section of the PLGA-SF NCs observed under SEM (A:100 × magnification, B:1000 × magnification).
Figure 9. SEM micrographs of Schwann cells cultured on the scaffolds for 3 days.
Figure 10. Cross-sections of regenerated nerves taken from an autograft and an NC implanted in a rat for 6 weeks. (A1). Autograft negative controls with toluidine blue staining (scale bar: 50 μm). (A2). PLGA-SF NC with toluidine blue staining (scale bar: 50 μm). (B1). Autograft negative control with transmission electron micrographs (scale bar: 1 μm). (B2). The PLGA-SF NC with transmission electron micrographs (scale bar: 1 μm).
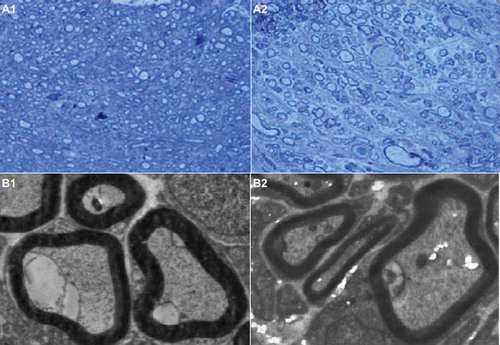
Figure 11. Plot showing the diameter of regenerated nerve fibers and thickness of regenerated myelin sheath. Results are mean ± SD for two grafts. (A: test group; B: autograft controls).