Figures & data
Figure 1. The effect of different molecular-weighted dextrans as additives on the thermal stability of GOD.
Figure 2. The effect of used 75 kDa dextran concentration on the thermal stability of GOD.
Figure 3. pH profile of GOD activity in the presence of additives (in the presence of 10, 20, and 30% (w/v) 75 kDa dextran). Experimental conditions were 30 °C and incubation for 1 h. Each data point represents the average value of three independent experiments with error bars indicated.
Figure 4. SPM images of the native GOD (A) and GOD in the presence of 30% (w/v) dextran (B).
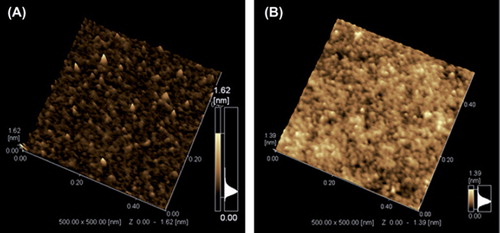
Table I. Effect of dextran on the storage stability of GOD at 4°C. Each data point represents the average value of three independent experiments.
Figure 5. Inactivation course of native (<) and dextran in concentration 30% (w/v) (Mw 75 kDa) treated GOD (<) in presence of liquid-organic interface (a); under strong agitation (1200 rpm) (b). Experimental conditions were 25 °C and pH 5.0. Each data point represents the average value of three independent experiments.