Figures & data
Table I. Hemodynamics at different time points of each group.
Table II. MCE results assessing RA and NRA.
Figure 1. Excised heart stained with Evans blue dye and thioflavin-S. Normal myocardium, reperfusion area, and NRA were dark blue, yellow, and dark red, respectively, in room light (A,C,E), while black, bright yellow, and deep red, respectively, in UV light (B,D,F). A,B: sham-operation group; C,D: control group; E,F: garlicin group.
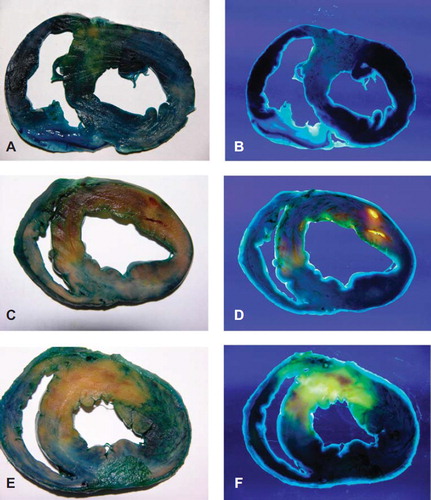
Table III. Pathological staining assessing RA and NRA.
Table IV. Serum IL-6 at different time of each group(pg/ml)
Table V. Serum TNF-α at different time of each group(ng/ml).
Table VI. Serum ET-1 at different time of each group (pg/ml)