Figures & data
Figure 1. FTIR spectra: (a) poly(HEMA); (b) poly(HEMA–MATrp).
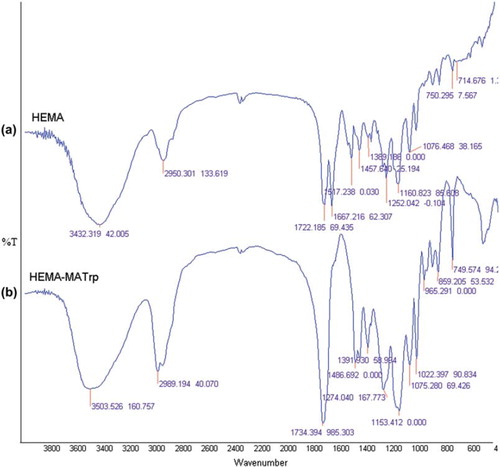
Figure 2. SEM photograph of nano-MIP.
Figure 3. Zeta-sizer result of nano-MIP.
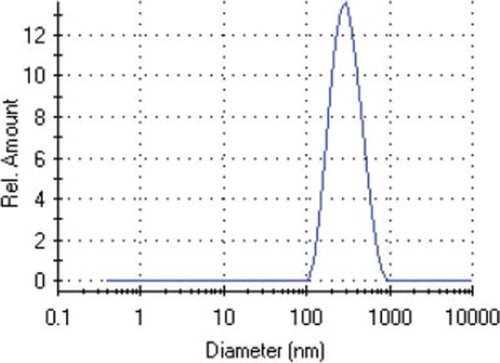
Figure 4. Atomic force microscopy images of nano-MIP.
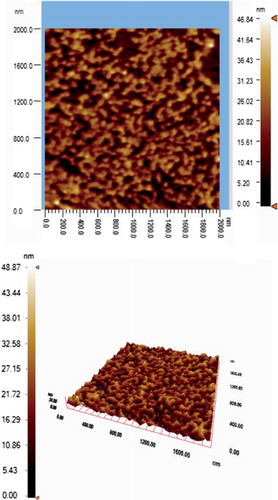
Figure 5. The effect of pH on lysozyme adsorption: lysozyme concentration: 1.0 mg/mL; incubation time: 2 h; temperature: 25°C.
Figure 6. Effect of concentration of lysozyme on the lysozyme adsorption; incubation time: 2 h; pH: 10.0; temperature: 25°C.
Figure 7. Effect of salt type and concentration on lysozyme adsorption; lysozyme concentration: 0.5 mg/mL; incubation time: 2 h; pH: 10.0; temperature: 25°C.
Figure 8. Effect of temperature on lysozyme adsorption; lysozyme concentration: 0.5 mg/mL; incubation time: 2 h; pH: 10.0.
Figure 9. Effect of time on lysozyme adsorption; lysozyme concentration: 1.0 mg/mL; incubation time: 2 h; pH: 10.0; temperature: 25°C
Table I. Pseudo-first and second-order kinetic constants determined for nano-MIP and nano-NIP.
Figure 10. Adsorption capacities of the nano-MIP and nano-NIP for lysozyme, BSA, and Cyt-c. Adsorption time: 2 h; T: 20°C.
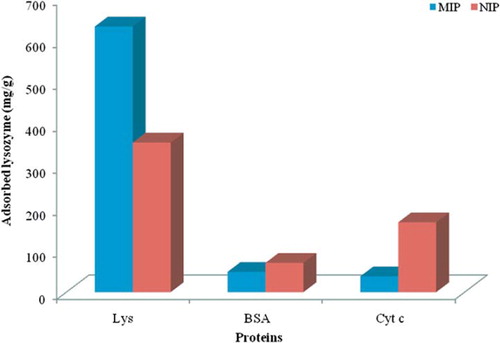
Table II. The distribution (Kd), selectivity (k), and relative selectivity (k′) coefficient values of BSA and Cytochrome-c with respect to lysozyme.
Figure 11. SDS-PAGE of egg white fractions. The fractions were assayed by SDS-PAGE using 10% separating gel (9 × 7.5 cm), and 5% stacking gels were stained with 0.25% (w/v) Coomassie Brillant R 250 in acetic acid–methanol–water (1:5:5, v/v/v) and destained in ethanol–acetic acid–water (1:4:6, v/v/v). Lane 1, egg white before adsorption; lane 2, egg white after adsorption; lane 3, commercial lyzoyme; lane 4, commercial marker; lane 5, desorbed lysozyme. Equal amounts of sample were applied to each line.
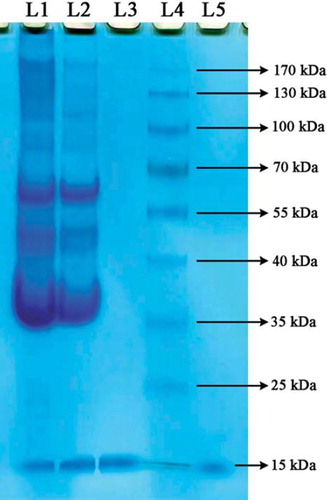
Figure 12. Reusability of nano-MIP; lysozyme concentration: 0.5 mg/mL; incubation time: 2 h; pH: 10.0; temperature: 25°C. Desorption agent: 1M ethylene glycol.