1,115
Views
10
CrossRef citations to date
0
Altmetric
Research Article

Surface modification of PBT nonwoven fabrics used for blood filtration and their blood compatibility study

, , , &
Pages 317-325 | Received 07 Jan 2012, Accepted 10 Jan 2012, Published online: 13 Mar 2012

Figures & data

Table I. Chemical composition of original and PVP-modified PBTNFs from XPS.

Figure 1. XPS high-resolution C-1 spectra of original PBTNF (a) and PBTNF-P200 (b); 209 × 297 mm (300 × 300 DPI).
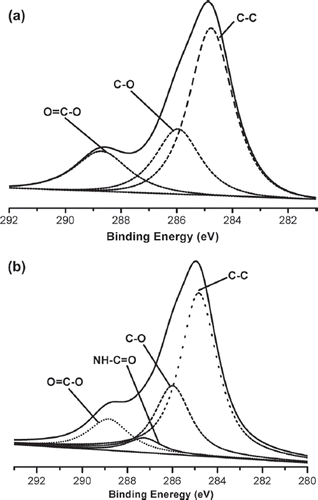
Figure 1. XPS high-resolution C-1 spectra of original PBTNF (a) and PBTNF-P200 (b); 209 × 297 mm (300 × 300 DPI).

Table II. High-resolution XPS C-1 data for original and PVP modified PBTNFs.

Table III. The surface CWST of PBTNFs.

Figure 2. Leukocyte retention, erythrocyte recovery, and platelet retention rates; 289 × 200 mm (300 × 300 DPI).
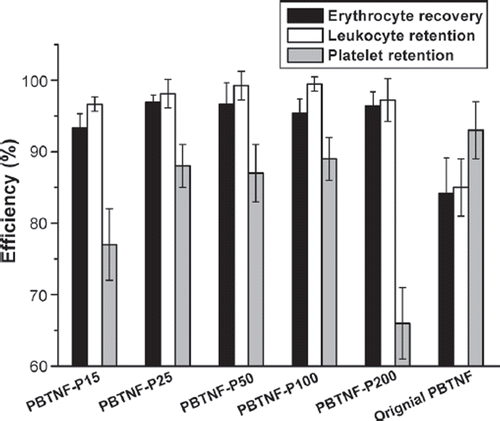
Figure 2. Leukocyte retention, erythrocyte recovery, and platelet retention rates; 289 × 200 mm (300 × 300 DPI).

Figure 3. FHb in whole blood that were filtered by original PBTNF and PBTNF-PVP; 289 × 200 mm (300 × 300 DPI).
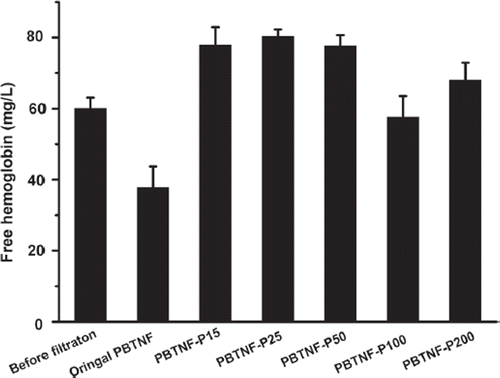
Figure 3. FHb in whole blood that were filtered by original PBTNF and PBTNF-PVP; 289 × 200 mm (300 × 300 DPI).

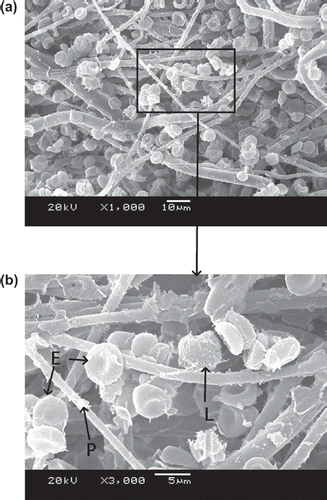
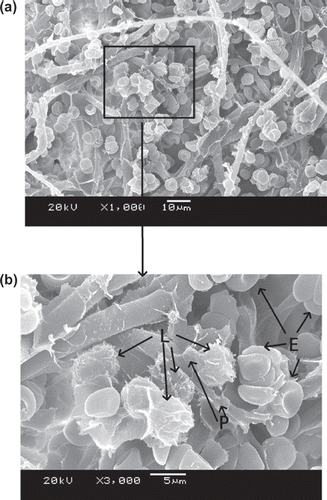
Figure 4. SEM photos of original PBTNF [erythrocytes (E), leukocytes (L), platelet (P)]; 189 × 274 mm (300 × 300 DPI).

Figure 4. SEM photos of original PBTNF [erythrocytes (E), leukocytes (L), platelet (P)]; 189 × 274 mm (300 × 300 DPI).

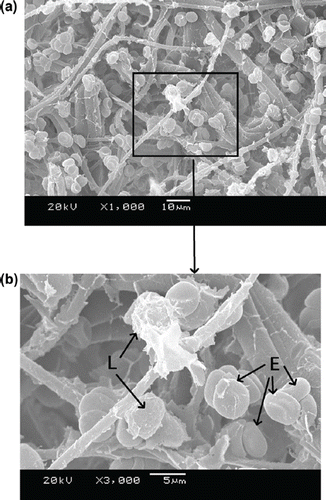
Figure 5. SEM photos of PBTNF-P15; 189 × 274 mm (300 × 300 DPI).

Figure 5. SEM photos of PBTNF-P15; 189 × 274 mm (300 × 300 DPI).

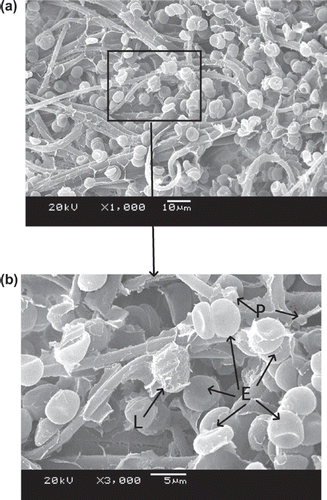
Figure 6. SEM photos of PBTNF-P25; 189 × 274 mm (300 × 300 DPI).

Figure 6. SEM photos of PBTNF-P25; 189 × 274 mm (300 × 300 DPI).

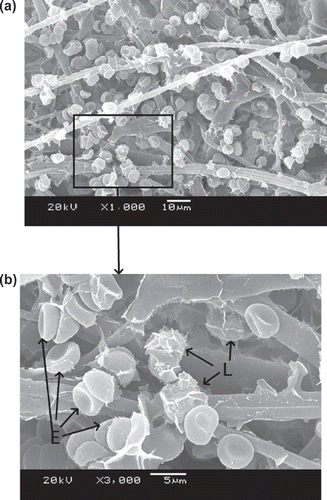
Figure 7. SEM photos of PBTNF-P50; 189 × 274 mm (300 × 300 DPI).

Figure 7. SEM photos of PBTNF-P50; 189 × 274 mm (300 × 300 DPI).

Figure 8. SEM photos of PBTNF-P100; 189 × 274 mm (300 × 300 DPI).

Figure 8. SEM photos of PBTNF-P100; 189 × 274 mm (300 × 300 DPI).

Figure 9. SEM photos of PBTNF-P200; 189 × 274 mm (300 × 300 DPI).

Figure 9. SEM photos of PBTNF-P200; 189 × 274 mm (300 × 300 DPI).

Table IV. The results of C3a and C5a determination.

Reprints and Corporate Permissions

Please note: Selecting permissions does not provide access to the full text of the article, please see our help page How do I view content?

To request a reprint or corporate permissions for this article, please click on the relevant link below:

Academic Permissions

Please note: Selecting permissions does not provide access to the full text of the article, please see our help page How do I view content?

Obtain permissions instantly via Rightslink by clicking on the button below:

If you are unable to obtain permissions via Rightslink, please complete and submit this Permissions form. For more information, please visit our Permissions help page.