Figures & data
Figure 1. Schematic diagram of molecular buffer array: (a) PANDA ring resonator; (b) atomic array and network; (c) diagram of optical trapping forces are formed by scattering force and gradient force; (d) molecular buffer array in hollow liquid corewaveguides.
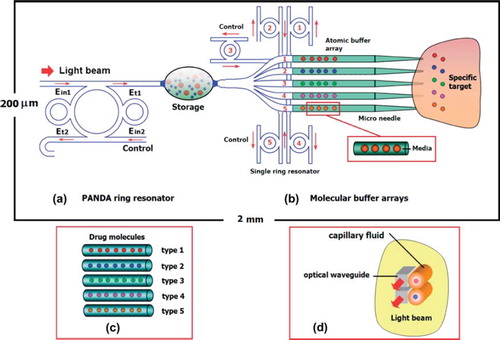
Figure 2. Results of the trapping tools: (a) wavelengths center 400 nm; (b) 450 nm; (c) wavelengths center 500 nm and 600 nm; (d) the normalized of wavelengths center 500 nm and 600 nm, Rad = 2 μm, RR = RL = 1 μm. The coupling coefficients are fixed κ0 = 0.95, κ1 = 0.5, κ3 = 0. 5; κ2 are varied at 0.2, 0.3, 0.4; the input power is 1 W.
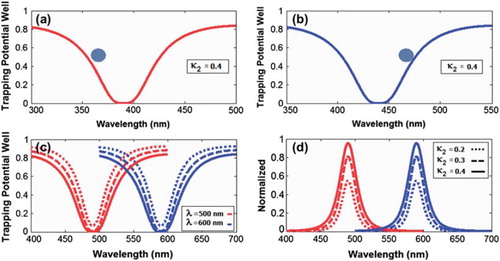
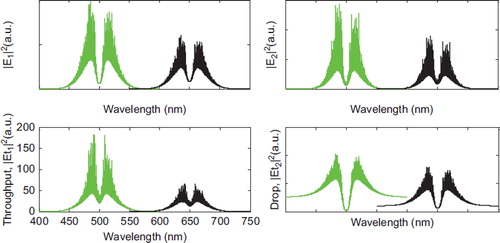
Figure 3. Results of the trapping tools at wavelengths center 500 nm and 650 nm; the coupling coefficients are given as κ0 = 0.5, κ1 = 0.35, κ2 = 0.1, and κ3 = 0.35, respectively. The ring radii are Radd = 2 μm, RR = RL = 1 μm, respectively.