Figures & data
Table I. The parameters of PolyPHb solution
Figure 1. The experimental protocol of this study. HES: hetastarch; MAP: mean arterial pressure.
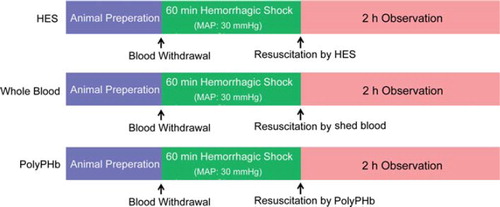
Figure 2. The MAP recovery after hemorrhagic shock and resuscitation of the three groups. Values were presented as mean ±SD (n = 15 – 18). ***P < 0.001 vs. the HES group. †P < 0.05 vs. the Whole Blood group. MAP: mean arterial pressure.
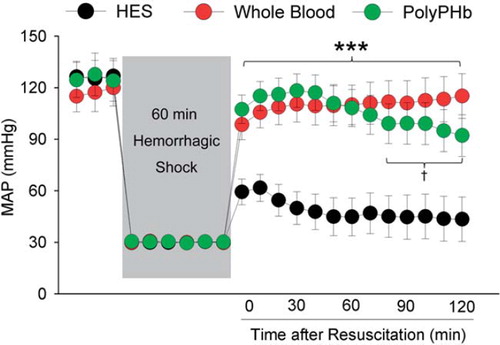
Figure 3. The HR (A), LVSP (B), ± dp/dt (C and D), and LVEDP (E) of the three groups. Values were presented as mean ± SD (n = 15 – 18). * * *P < 0.001 vs. the HES group. HR: heart rate; LVSP: left ventricular systolic pressure, ±dp/dt: maximum left ventricular developed pressure increase and decrease rate, LVEDP: left ventricular end-diastolic pressure; N.S.: nonsignificant.
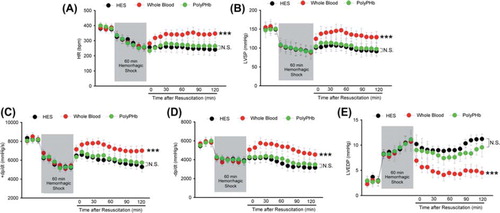
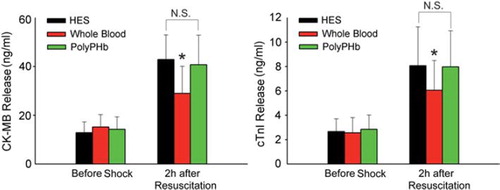
Figure 4. The CK-MB and cTnI releases of the three groups before shock and 2 h after resuscitation. Values were expressed as mean ± SD (n = 15 – 18). *P ± 0.05 vs. the HES group. CK-MB: creatine kinase-MB; cTnI: cardiac troponin-I; N.S.: nonsignificant.