Figures & data
Figure 1. Curve of tumor growth. Note *P < 0.05 compared with control; #P < 0.05 compared with group 2; ΔP < 0.01 compared with control.
Figure 2. Immunohistochemical staining of HIF-1α in tumor tissue: A. Representative pictures of immunohistochemical staining of HIF-1α in groups. Intense cytoplasmic and nucleus staining of HIF-1α in control. Positive stain of HIF-1α (black arrow). B. Quantitative analysis of average optic density of positive stain in specimen. Note *P < 0.01 compared with control; #P < 0.05 compared with group 2. Scale bar, 25μm for G1-G4.
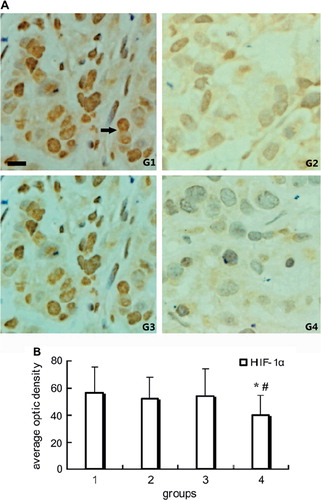
Figure 3. Immunohistochemical staining of MDR1 in tumor tissue: A. Representative pictures of immunohistochemical staining of MDR1 in groups. Positive stain of MDR1 (black arrow). B. Quantitative analysis of average optic density of positive stain in specimen. *P < 0.01 compared with other three groups; scale bar, 25 μm for G1-G4.
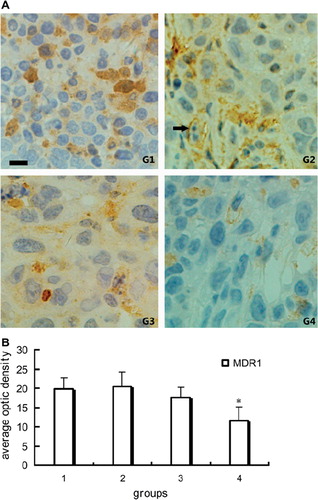
Figure 4. Western blot analysis of HIF-1α and MDR1 protein in tumor tissue: HIF-1α and MDR1 expression in different groups. Quantitative analysis of HIF-1α and MDR1 protein expression. Relative gray values versus β-actin. *P < 0.01 compared with other three groups.