Figures & data
. Levels and values for independent factors in Box-Behnken experimental design
Figure 1. Setup Representing Test for Mucoadhesive Strength of Microbeads.
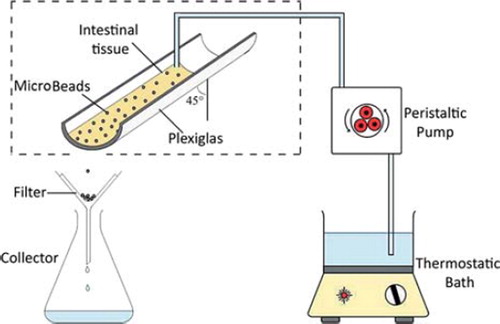
Figure 2. FTIR Spectra of (A) Unexposed CXA + Excipients blend, (B) Exposed CXA + Excipients blend, (C). Excipients blend without CXA and (D) Untreated CXA.
Figure 3. DSC Th ermograms of (A) Untreated CXA, (B) Excipients blend without CXA, (C) Exposed CXA + Excipients blend and (D) Unexposed CXA + Excipients blend.
Figure 4. XRPD Patterns of Pure CXA and CCXA Microbead Formulation.
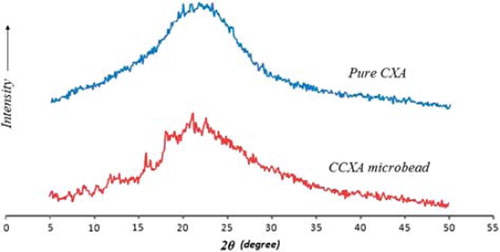
Figure 5. Single Factor Correlation between Independent and Response Variables.
. Experimental design and corresponding responses in terms of dependent variables and evaluation parameters.
Table III. ANOVA for response surface quadratic models correlating different response variables.
. Details of constraints set for RSM, and optimized formula proposed by Design Expert® software.
Figure 6. Response Graphs and Contour Plots for % Yield and Entrapment Efficiency.
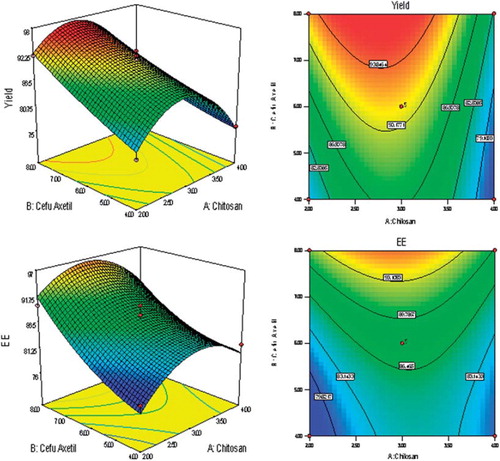
Figure 7. SEM Images of Optimized Microbeads Formulation A, B, C (MB 17) and Control Microbead Formulation D, E, F (MB 18).
Figure 8. Response Graphs and Contour Plots for % MS and T90%.
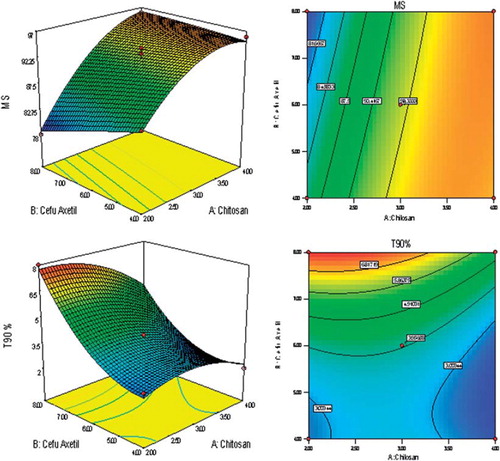
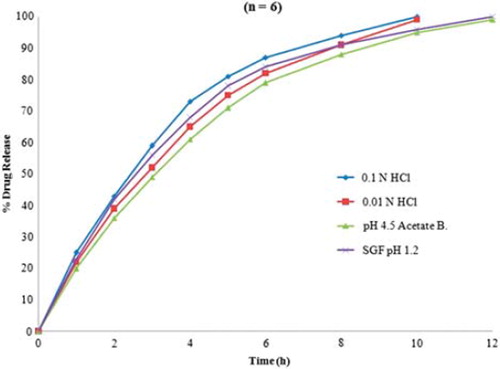
Figure 9. Dissolution Profile of Optimized Formulation (MB 17) in Diff erent Acidic Media.