Figures & data
Figure 1. The flow field in culture flasks at different agitation speeds. A: 30 rpm, B: 45 rpm, C: 60 rpm, D: 80 rpm.
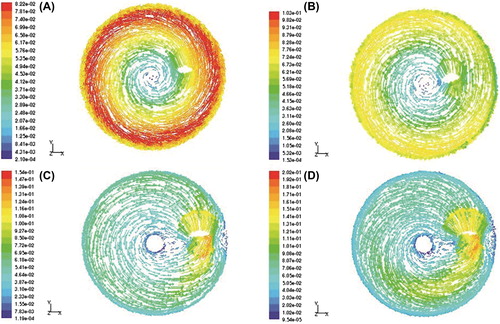
Figure 2. Expansion of total cell at different agitation speeds. *: P < 0.05 vs Control; **: P < 0.01 vs Control.
Table 1. CFC density in the culture at different agitation speeds.
Table 2. CD34 + cell population in the culture at different agitation speeds.
Figure 3. CD34 + cells expansion at different agitation speeds. *: P < 0.05 vs Control; **: P < 0.01 vs Control.