Figures & data
Figure 1. A PANDA microring resonator.
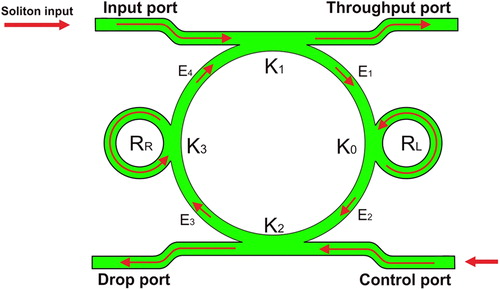
Figure 2. Schematic diagram of molecular filter, where (a) an embedded PANDA microring resonator, (b) molecule movement along the waveguide via a through port.
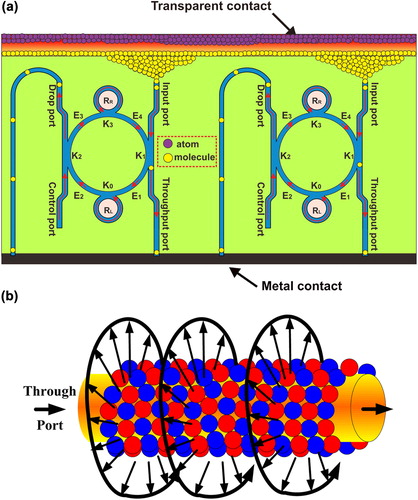
Figure 3. Results of dynamic optical tweezers generated at four different center wavelengths, where (a) |E1ǀ2, (b) |E2ǀ2, (c) ǀE3|2, (d) ǀE4ǀ2, (e) through, and (f) drop port signals.
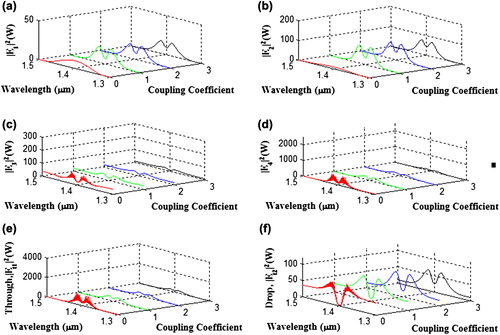
Figure 4. (a) An optical tweezer and trapped electron generated by a PANDA microring resonator, (b) results of the trapping potential well with various coupling coefficients (kappa, κ).
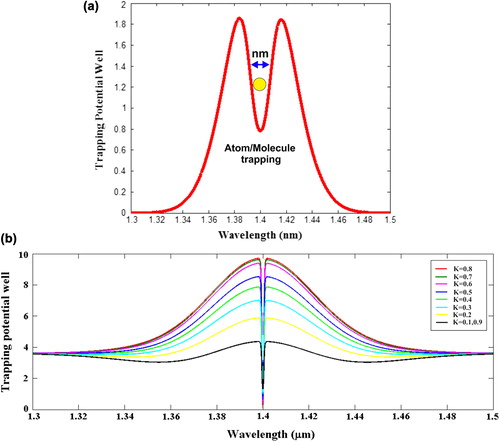
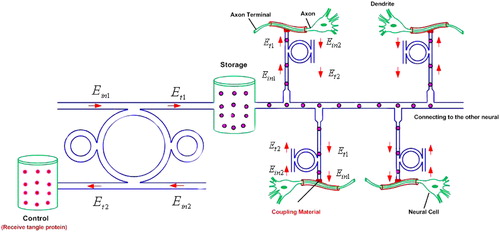
Figure 5. Drug filter in the targeting network.