Figures & data
Table I. The swelling ratio of the scaffold prepared from the high molecular chitosan (500 mg/100 ml) and 5% alginate.
Figure 1. Scanning electron microscope pictures of the high molecular chitosan (500 mg/100 ml) and 5% alginate. A. The surface of the scaffold with a pore size approximately 50–350 μm. B. The cut surface of the scaffold. C. Chondrocytes (arrows) are well attached to the scaffold. D. Chondrocyte attachment (arrow) to the wall of the pores. E. Chondrocytes are covered the entire scaffold surface on the 3rd day of the culture. F. Empty surface areas devoid of chondrocytes are visible on the surface.
Figure 2. Catechin release from the scaffold prepared from solution of the high molecular chitosan (500 mg/100 ml) and 5% alginate.
Table II. DNA content measured in 1 g of scaffold during the incubation period.
Table III. GAG content measured in 1 g of scaffold during the incubation period.
Figure 3. Agarose gel documentation PCR analyses of collagen type I and collagen type II. A. A strong collagen type II band and a weaker collagen type I bands were expressed until the 8th day of the culture. The gel picture belonged to the chondrocyte seeded scaffolds devoid of catechin at the 5th day. B. The collagen type I band was no longer at the 14th day. The gel picture belonged to the chondrocyte-seeded scaffolds loaded with catechin at the 14th day. M = DNA marker; col1 = collagen type I, col2 = collagen type II; b-act = β2-microglobulin.
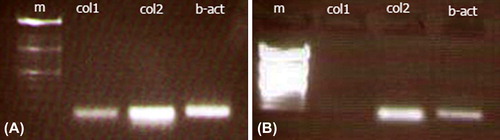
Figure 4. Histology of the chondrocyte seeded scaffolds. A. Chondrocytes are attached to scaffolds well and exhibited metachromatic staining. B. At the 14th day of the culture, chondrocytes with metachromatic staining can be seen C. Chondrocyte attachments onto the wall pore (arrows), D. Collagen type II immunoreactive chondrocytes (arrows) and non-immunoreactive chondrocytes (arrow head). Toluidine blue staing (A and B), hematoxylin&Eosin (C) and Collagen type immunoflourecence with FITC maker and propidium iodide nuclear staining. Bar = 80 μm in A, B, and C and = 160 μm.
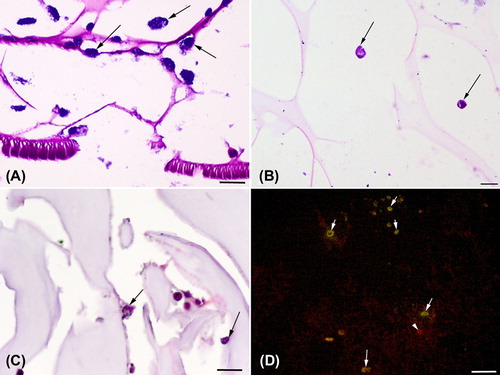
Table IV. The percentage of round chondrocytes at different time point in alginate-chitosan scaffolds.
Table V. The percentage of collagen type II immunoreactive chondrocytes at different time point in alginate-chitosan scaffolds.