Figures & data
Figure 1. The image of GFP-GVs captured through a 40 × objective in a (A) bright field mode and B: Fluorescence mode. C: Enzs-GV upon addition of n-heptanol. D: Image of multilamellar vesicle containing Enzs-GV. In 1C, 1D Scale Bar: 40 μm. Each camera pixel represents 0.2 μm in the images 1A, 1B.
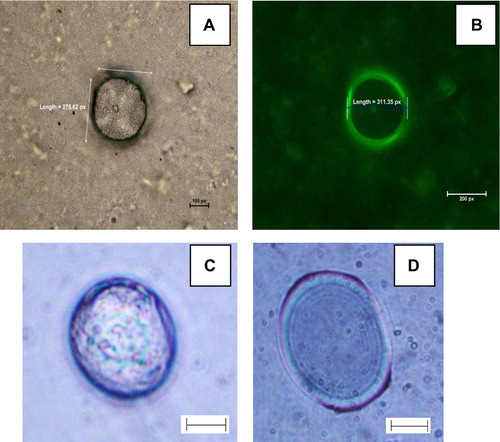
Figure 2. Spectrophotometric monitoring of the Enzs-GV catalyzed oxidation of n-heptanol. The Enzs-GV concentrations used were A = 100 μl, B = 200 μl, C = 400 μl, D = 600 μl, where the count of GV was 5/μl in THB. The concentrations of n-heptanol for the entire sample were fixed (100 μl) and the stock was prepared in DMSO.
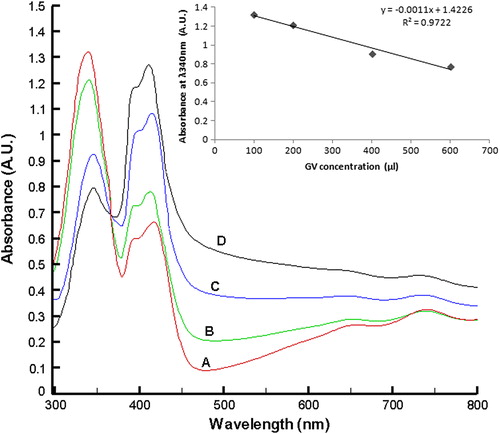
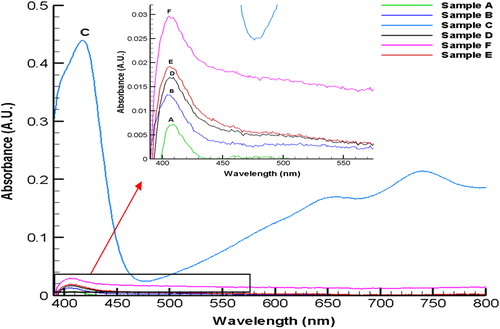
Figure 3. Visible spectra for the AOx catalyzed oxidation of different substrate alcohols (each 50 μl in DMSO) added externally to Enzs-GV. A, methanol; B, butan-1ol; C, n-heptanol; D, R-(2)-octanol; E, 1- undecanol; F, 2-dodecanol.