Figures & data
Figure 1. Flow chart explaining the selection of eligible studies included in the meta-analysis.
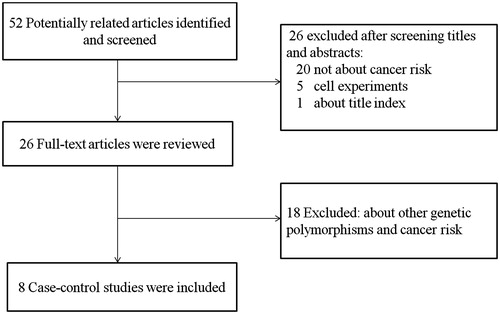
Table 1. Characteristics of all eligible studies.
Figure 2. Forest plot of the IL-27 -964A/G polymorphism and cancer risk using fixed-effect model (homozygous model GG versus AA): subgroup analysis by cancer type. CRC colorectal cancer; NPC nasopharyngeal carcinoma; Other esophageal cancer, glioma, hepatocellular carcinoma, epithelial ovarian cancer, respectively.
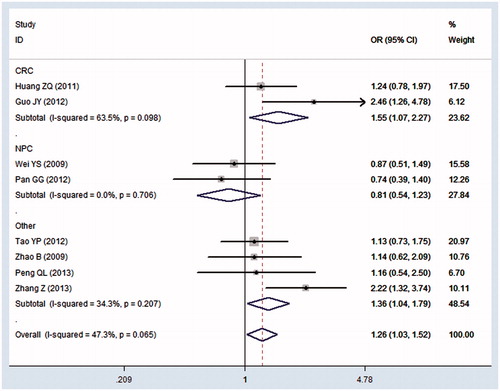
Table 2. Meta-analysis results of IL-27 rs153109 polymorphism and cancer risk.
Figure 3. The sensitivity analysis of IL-27 -964A/G polymorphism with cancer risk (homozygous model GG versus AA). The middle vertical axis indicates the overall OR, and the two vertical axes indicate its 95% confidence interval (CI). Every hollow round indicates the pooled OR when the left study was omitted in this meta-analysis.
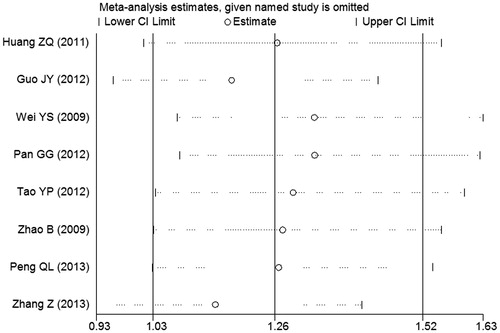
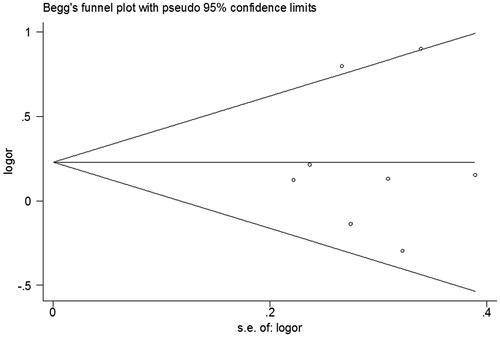
Figure 4. Begg’s funnel plot in the meta-analysis of the association between IL-27 -964A/G polymorphism and cancer risk (homozygous model GG versus AA).