Figures & data
Figure 1. An acetabular cup surface model obtained after segmentation of CT pelvic images. To eliminate metallic artifacts, the intensity threshold was set at a level where only the cup was selected.
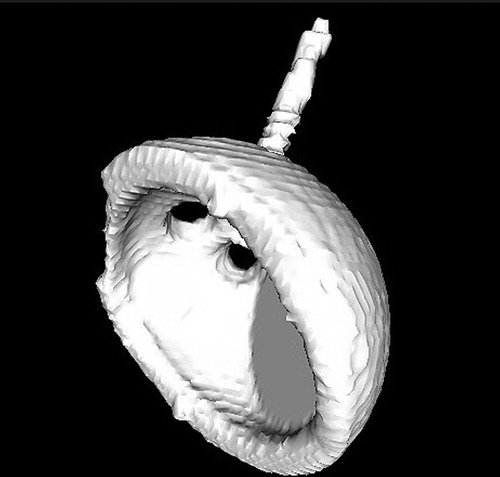
Figure 2. Computer screen view of pelvic CT slices and cup surface model. A CAD (computer-aided design) graphic model of the cup was superimposed on the segmented surface model and its orientation was continuously modified (see arrows) until the best possible match was found between the two models. This final orientation was recorded in terms of cup abduction and version with respect to the previously defined anatomic reference system.
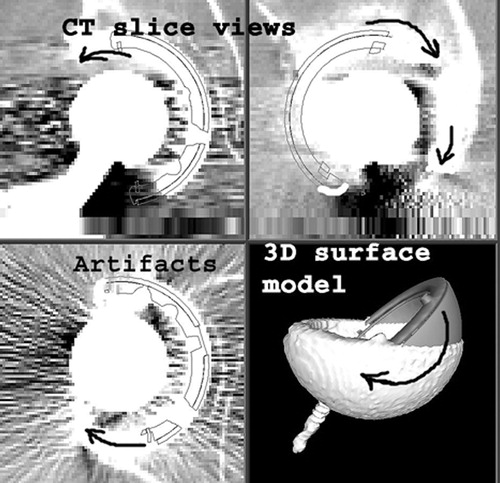
Figure 3. Computer screen view of the Xalign software interface. A real postoperative AP pelvic X-ray was loaded at upper-right, while a synthetic pelvic X-ray, generated by the software using the CT data, occupied the lower-left quarter. The best possible intensity match between the two images was obtained by overlaying them (upper-left). The anatomic reference system, defined on CT images, was thereby transferred to the examined postoperative X-rays.
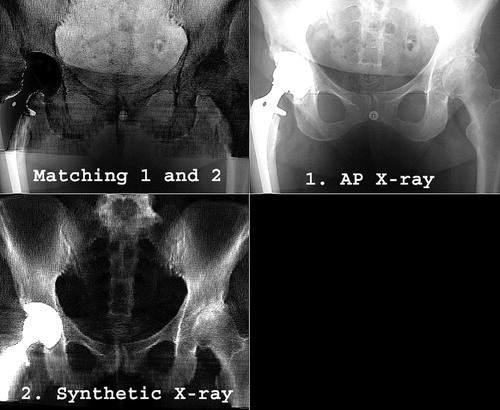
Figure 4. Computer screen view of the last step of the Xalign algorithm. A projection of the CAD model of the cup was overlaid on and matched with the actual X-ray cup projection to determine the cup abduction and version with respect to the anatomic reference system.
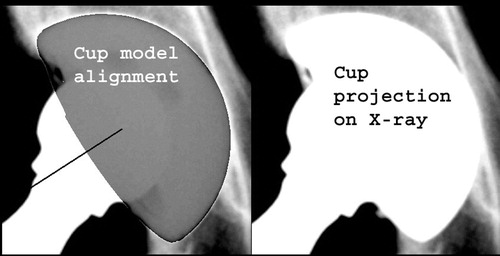
Figure 5. Variation of the pelvic flexion angle, as measured from CT scans. The inter-subject variability ranged from −14° to 15° in this limited group of 19 patients.
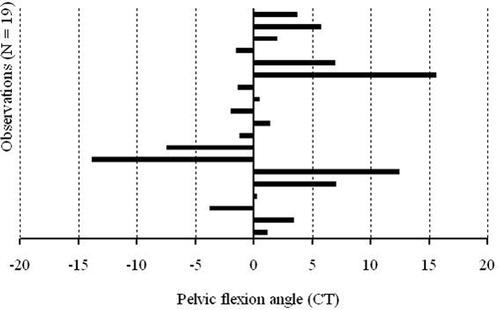
Figure 6. Graphic representation of Xalign measurement errors for cup abduction and version.
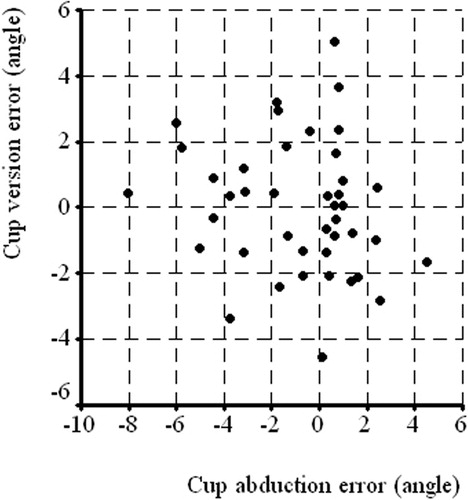
Figure 7. Variation of the pelvic flexion angle measured using the Xalign algorithm.
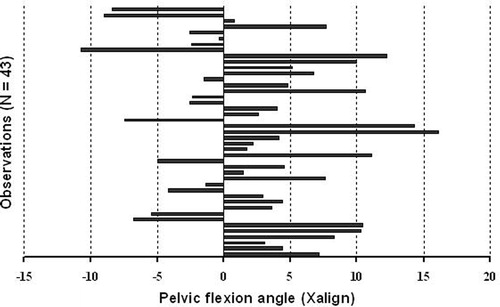
Table I. Xalign errors for cup abduction and version.
Table II. Pelvic spatial orientation angles.
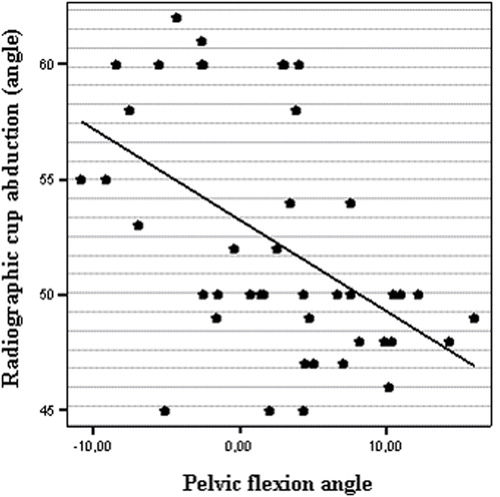
Figure 8. Scatter plot representing the significant correlation between pelvic flexion angle and radiographic measurements of cup abduction (r = −0.5, p = 0.001).