995
Views
25
CrossRef citations to date
0
Altmetric
Original

How does soft tissue distribution affect anteversion accuracy of the palpation procedure in image-free acetabular cup navigation? An ultrasonographic assessment

, &
Pages 87-92 | Received 03 Jun 2003, Accepted 12 Dec 2004, Published online: 06 Jan 2010

Figures & data

Figure 1. Symbolic depiction of geometric (w and o., blue), ultrasonographic measurement (li, r. i., and s. y., red) and geometric calculation (h, green). [Color version available online.]

Figure 1. Symbolic depiction of geometric (w and o., blue), ultrasonographic measurement (li, r. i., and s. y., red) and geometric calculation (h, green). [Color version available online.]

Figure 2. Exemplary depiction of ultrasound examination of one patient. (a) Static, sagittal B-mode image of the anterior superior iliac spine. In this particular case, the distance from skin to bone measured 10 mm. (b) Static, sagittal B-mode image of the symphysic area. Here, the distance from skin to bone measured 17 mm.

Figure 2. Exemplary depiction of ultrasound examination of one patient. (a) Static, sagittal B-mode image of the anterior superior iliac spine. In this particular case, the distance from skin to bone measured 10 mm. (b) Static, sagittal B-mode image of the symphysic area. Here, the distance from skin to bone measured 17 mm.

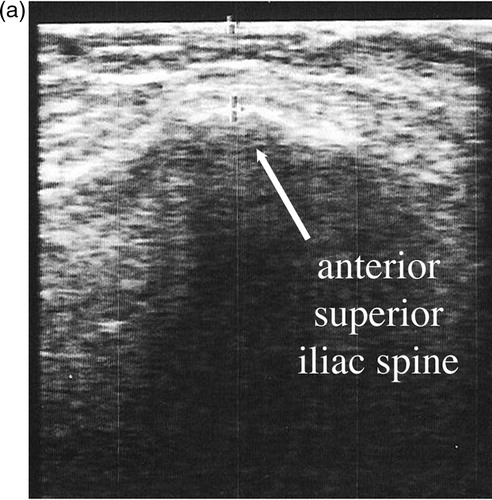
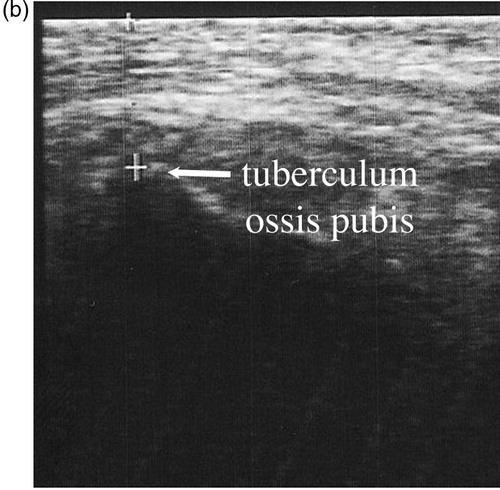
Table I.  Summary of the patients' biometric data, ultrasound measurements, and statistical evaluation referring to misinterpretation of anteversion.

Figure 3. Plots of the individual misinterpretation of anteversion (°) v. s. (a) body weight (kg), (b) body mass index (kg/m2), (c) pelvic width (cm), and (d) height of the triangle defining the frontal pelvic plane (cm). Data of male patients are depicted with black triangles (▴) and female patients with white circles (O).

Figure 3. Plots of the individual misinterpretation of anteversion (°) v. s. (a) body weight (kg), (b) body mass index (kg/m2), (c) pelvic width (cm), and (d) height of the triangle defining the frontal pelvic plane (cm). Data of male patients are depicted with black triangles (▴) and female patients with white circles (O).

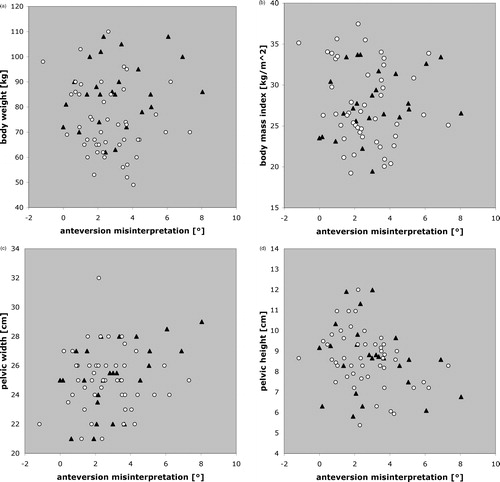
Table II.  Data describing the earlier plotted correlations ().

Reprints and Corporate Permissions

Please note: Selecting permissions does not provide access to the full text of the article, please see our help page How do I view content?

To request a reprint or corporate permissions for this article, please click on the relevant link below:

Academic Permissions

Please note: Selecting permissions does not provide access to the full text of the article, please see our help page How do I view content?

Obtain permissions instantly via Rightslink by clicking on the button below:

If you are unable to obtain permissions via Rightslink, please complete and submit this Permissions form. For more information, please visit our Permissions help page.