Figures & data
Figure 1. Left: Standard microsurgical tools equipped with trackable marker arrays (during a rat microvascular anastomosis). Right: Marker array equipped with retro-reflective markers attached to forceps handle.
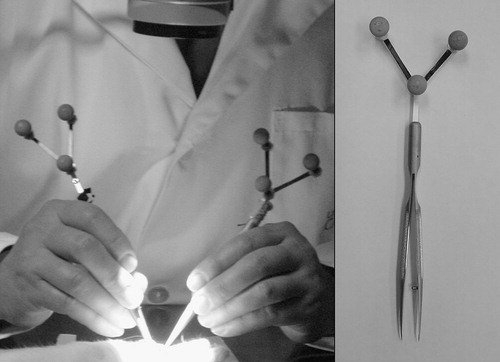
Figure 2. Microvascular anastomosis hierarchical decomposition.
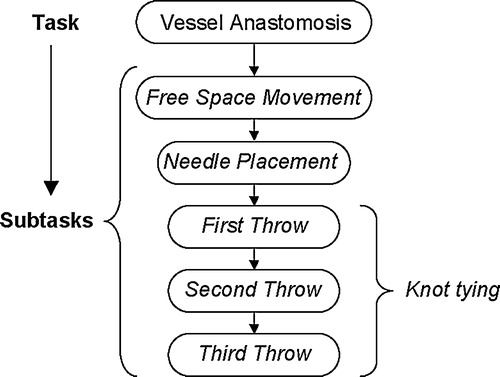
Figure 3. Data formatting steps.
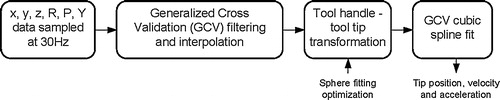
Table I. Kinematic performance measure definitions.
Figure 4. A: A comparison of CPD functions of any arbitrary performance measure using the K–S statistic. B: Bootstrapping approach based on resampling of two finite sets. C: Using the CPD of D from resampling to establish confidence bounds on D.
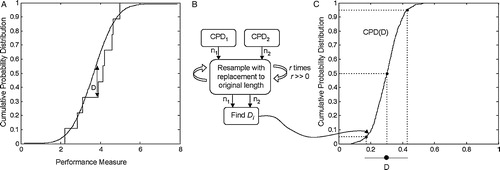
Table II. Summary of tool tracking and anastomosis results.
Figure 5. Sample of a three-dimensional tool tip trajectory (left) and a tool tip excursion profile (right) for a knot-throwing subtask.
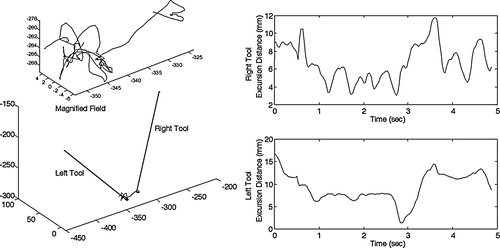
Figure 6. Performance measure results for an experienced surgeon. The error bars represent the plus or minus standard deviation.
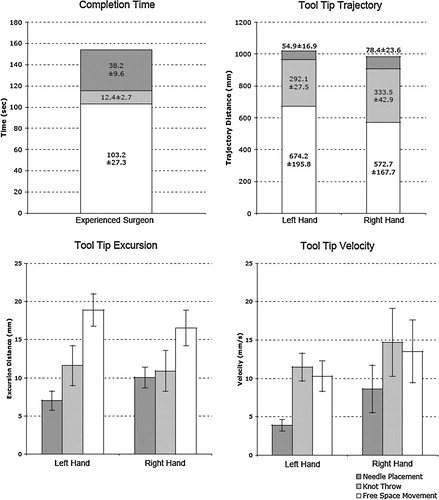
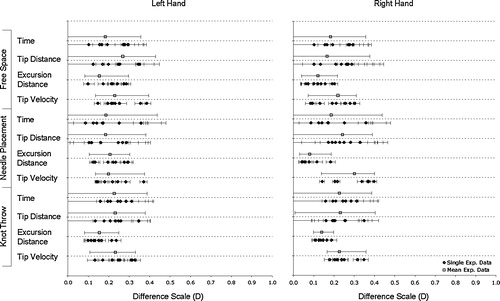
Figure 7. K–S difference statistic of performance measures for the right and left tools at the subtask level. The confidence intervals marked indicate a 90% confidence bound and are based on a bootstrap estimate.