Figures & data
Figure 1. The first two eigen modes of variation of our proximal femur model. The shape instances were generated by evaluating with
.
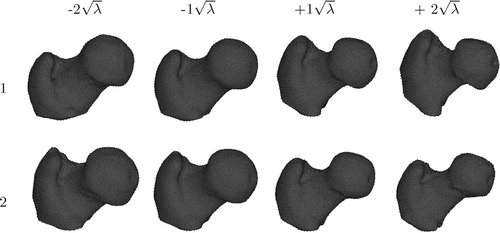
Figure 2. (a) The DRB attached to the ultrasound probe. (b) Automatically segmented bone contours in anatomical space.
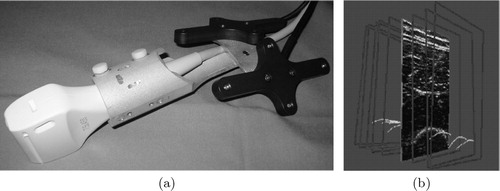
Table I. Error statistics of predicted shapes for Bone 1.
Table II. Error statistics of predicted shapes for Bone 2.
Figure 3. Statistics accumulated from the trials carried out by the two users on (a) Bone 1 and (b) Bone 2 using a tracked pointer to obtain surface points. The average mean error is plotted against the number of surface points digitized.
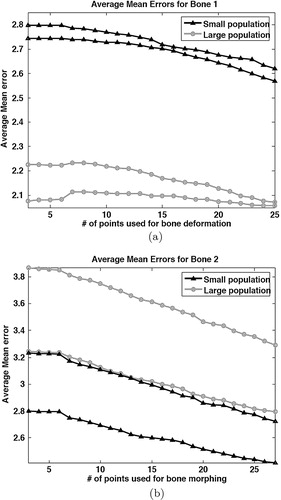
Figure 4. For each population, the average mean error is plotted against the number of digitized points.
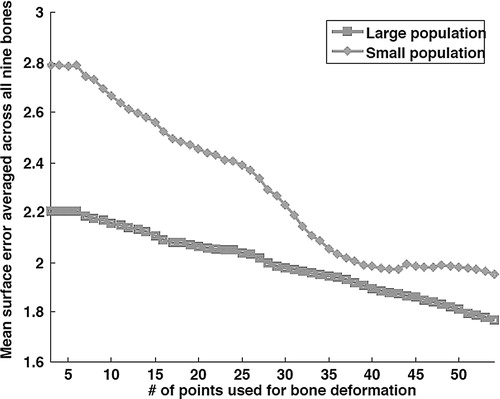
Table III. Mean surface errors for nine dry cadaver bones in the CT-based error scheme.
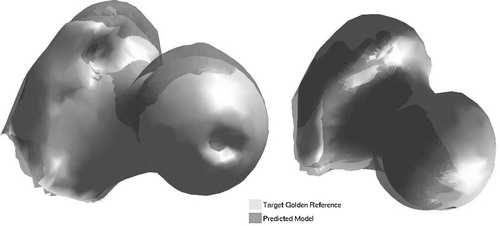
Figure 5. Pointer-based prediction: predicted models overlaid onto ‘gold’ references. Bone 1 (left): mean error = 1.76 mm; and Bone 2 (right): mean error = 2.78 mm.
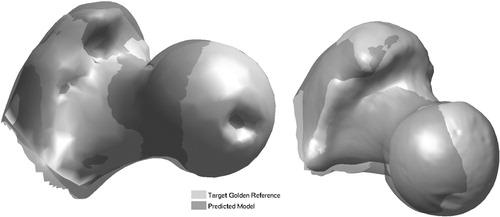
Figure 6. Ultrasound-based prediction: predicted models overlaid onto ‘gold’ references. Bone 1 (left): mean error = 3.08 mm; and Bone 2 (right): mean error = 2.90 mm.