Figures & data
Table I. Non-exhaustive list of the different criteria that could be required for the six femoral implant positioning parameters.
Figure 1. Location on a distal femur and proximal tibia statistical 3D model of the most commonly used landmarks in TKA.
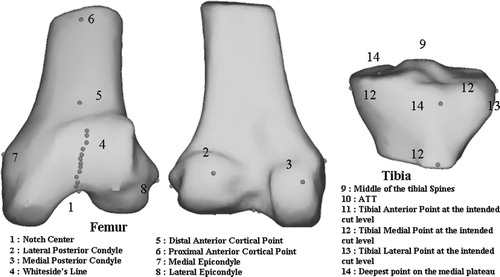
Figure 2. Number of trials in which the TKA implant positioning program system proposed the size in each size category (1, 2, 3, 4, or 5 for the femur (top) and 1, 2, 3, 4, 5, or 6 for the tibia (bottom)) per surgeon (SA: surgeon A; SB: surgeon B, etc.).
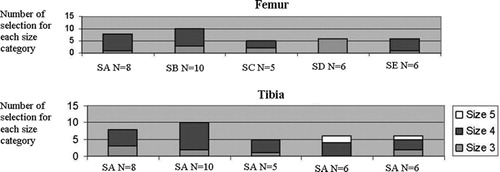
Table II. Mean and standard deviation for each of the five surgeons for the six datasets corresponding to the six degrees of freedom of the femoral implant positioning.
Table III. Mean and standard deviation for each of the five surgeons for the six datasets corresponding to the six degrees of freedom of the tibial implant positioning.
Figure 3. 3D visualization of the large variability for different landmarks acquired manually. For visualization only, these manual landmarks have been displayed on the BoneMorphing 3D models (color version available at online).
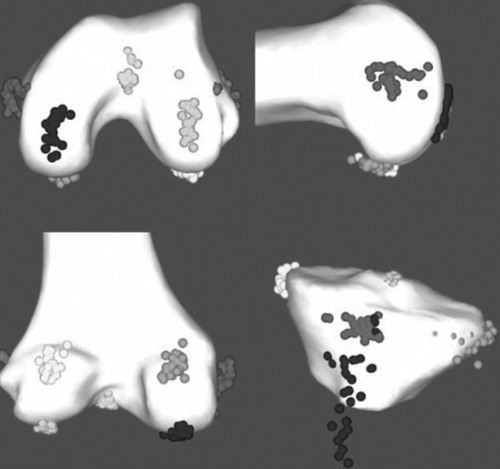
Table IV. Range of values and standard deviation in mm as described in the methods for landmarks digitized with the pointer for each operator.
Table V. Standard deviation (°) of the femoral ML direction serving as reference for the femoral AR for each acquisition method and anatomical direction definition.
Figure 4. X coordinates (proximal to distal axis, in mm) of the tibial medial plateau for each surgeon and acquisition method (pointer or BoneMorphing). The last column of the graph is the dataset combining all 35 trials (SA: surgeon A; SB: surgeon B, etc.).
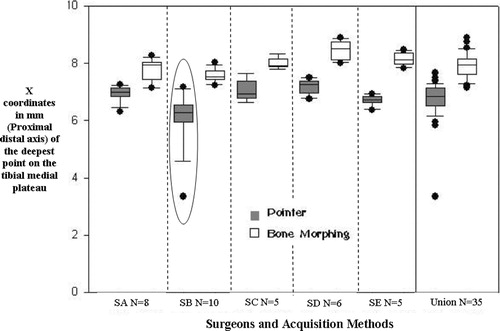
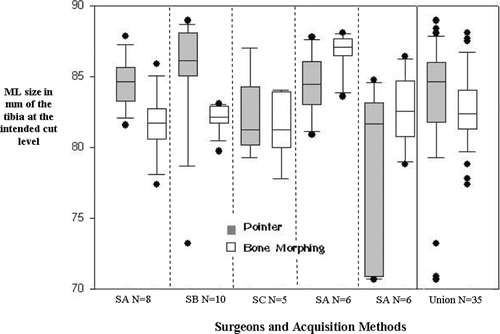
Figure 5. ML size (in mm) of the tibia at the cut level for each surgeon and acquisition method (pointer or BoneMorphing). The last column of the graph is the dataset combining all 35 trials (SA: surgeon A; SB: surgeon B, etc.).