Figures & data
Figure 1. Planning interface with 3D model in front of X-ray images.
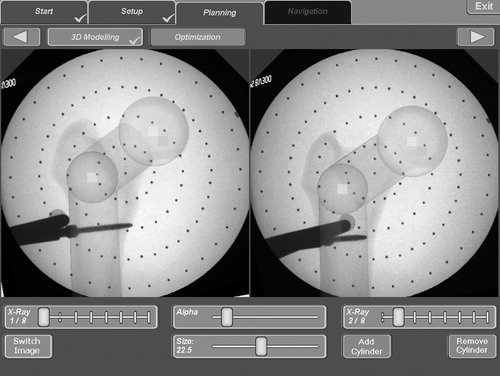
Figure 2. Optimization interface with preoperative (left column), target (center column) and calculated (diagram at right) parameters for leg-length variation, angulation, antetorsion and translation.
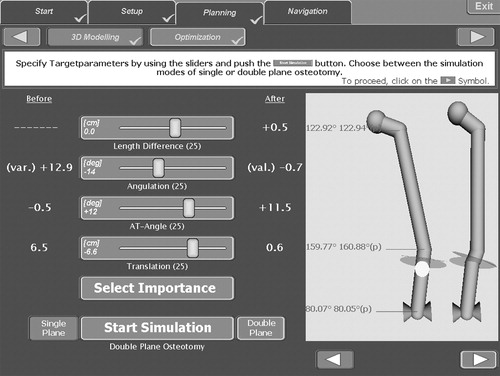
Figure 3. Worksteps of the second study: (a) preoperative deformed bone with fixed distal and proximal reference bases; (b) navigated drilling with k-wires; (c) marked osteotomy plane; (d) after manual osteotomy; (e) navigated osteosynthesis; and (f) measurement using a standard measurement board for anatomical investigations.
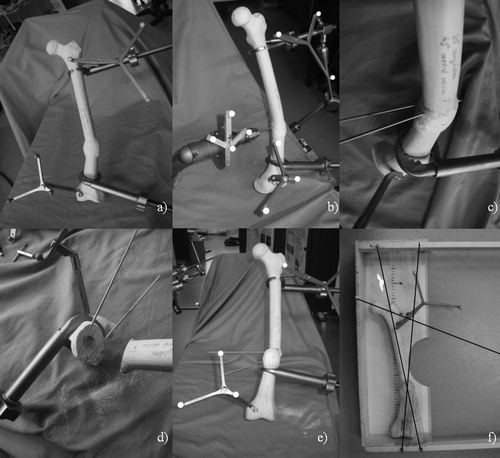
Table I. Results of first attempt at validating the selected optimization procedure.
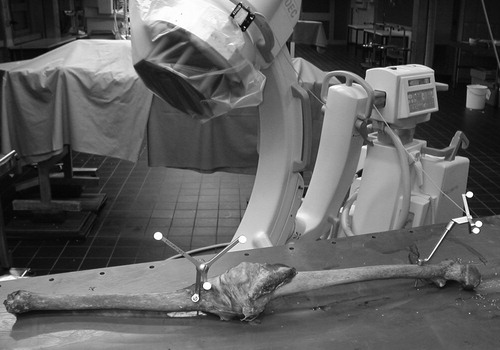
Figure 4. Evaluation of the kinematic method in cadaver studies using a C-arm and tracking system.