Figures & data
Figure 1. a) Isocentric beams from various directions leading to an inhomogenous distribution of beams, i.e., some target areas are not covered (black) and there is a single spot where all beams intersect (light gray). b) Non-isocentric beams from various directions. The beams do not all cross at a single point.
Figure 2. Tumor motion may result in partial underdosage. Without motion compensation, a margin is required. This leads to a substantial increase in integral radiation dose.
Figure 3. Live X-ray to determine the target position, using gold markers (circled in red) and infrared emitters (indicated by blue arrows). [Color version available online.]
![Figure 3. Live X-ray to determine the target position, using gold markers (circled in red) and infrared emitters (indicated by blue arrows). [Color version available online.]](/cms/asset/18e88d79-5434-4e6d-ba28-4770b4306789/icsu_a_188564_f0003_b.jpg)
Figure 4. Breathing motion with predicted (black) and measured (red) target movements. [Color version available online.]
![Figure 4. Breathing motion with predicted (black) and measured (red) target movements. [Color version available online.]](/cms/asset/da8989a9-82d0-4767-81b0-d7a4912fc9a2/icsu_a_188564_f0004_b.jpg)
Figure 5. Sphere packing for a non-spherical target shape results in uneven coverage (hot spots).
Figure 6. Sweeping an isocenter point along a line segment.
Figure 7. Placement of isocenter points for irregular shapes.
Figure 8. Experimental results showing the influence of the number of candidate beams on the number of monitor units. All other constraints were fixed and the tests were repeated multiple times for different random beam sets. The boxes give the maximum, upper quantile, mean, lower quantile, and minimum values. Any increase in the number of candidate beams beyond approximately 1500 does not lead to large improvements.
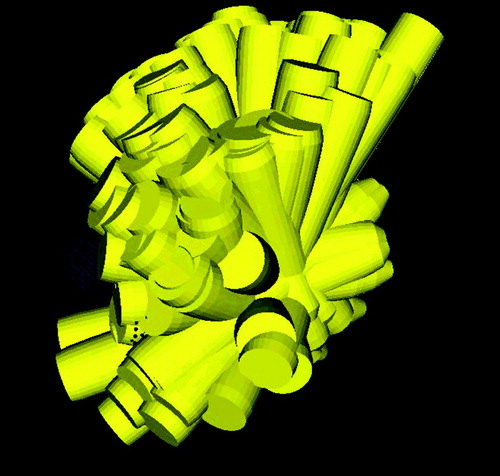
Figure 9. 3D arrangement of non-isocentric treatment beams computed by inverse planning for robotic radiosurgery.