Figures & data
Figure 1. Scatter plots showing the resultant scalar distances from the true hip joint center with (a) and without (b) a pelvic tracker. Note the tighter grouping of data points and fewer outliers in the pelvic tracker plot (all axes are marked in mm).
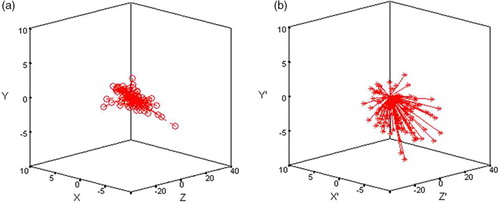
Table 1. Errors in the x-, y-, and z-directions associated with pin-based and pinless computer assisted HJC localization. δ is the scalar distance from the calculated HJC to the true center as determined by CT.
Figure 2. Sagittal and coronal malalignment of the mechanical axis following pelvic tracker-based and tracker-less functional algorithms (+sagittal angle = flexion; + coronal angle = varus in degrees; *p < 0.05 when comparing algorithms with and without a pelvic tracker).