Figures & data
Figure 1. An example noise image (a) and the generated reflectance map (b). Since a z-component of less than 0.5 corresponds to a back-facing normal vector that does not occur in reality, the blue channel will always have a value greater than 0.5, hence the dominant blue tone of the reflectance map. [Color version available online.]
![Figure 1. An example noise image (a) and the generated reflectance map (b). Since a z-component of less than 0.5 corresponds to a back-facing normal vector that does not occur in reality, the blue channel will always have a value greater than 0.5, hence the dominant blue tone of the reflectance map. [Color version available online.]](/cms/asset/4b05bfd8-9e33-442a-ae12-5350b725c6a2/icsu_a_202186_f0001_b.jpg)
Figure 2. Different views of a surface patch rendered using the proposed method (left) and the OpenGL multi-texturing approach (right). Notice the plastic-like surface and the hexagonal shape of the specular highlights with the multi-texturing method. [Color version available online.]
![Figure 2. Different views of a surface patch rendered using the proposed method (left) and the OpenGL multi-texturing approach (right). Notice the plastic-like surface and the hexagonal shape of the specular highlights with the multi-texturing method. [Color version available online.]](/cms/asset/80384894-8674-4ab0-967d-372d6fce690b/icsu_a_202186_f0002_b.jpg)
Figure 3. The effect of noise frequency on the rendering result, illustrating how different specular appearance of the tissue can be simulated. A higher noise frequency is used in the right image. [Color version available online.]
![Figure 3. The effect of noise frequency on the rendering result, illustrating how different specular appearance of the tissue can be simulated. A higher noise frequency is used in the right image. [Color version available online.]](/cms/asset/0e5b1aa3-db1d-4dba-b945-efc8d9c14100/icsu_a_202186_f0003_b.jpg)
Figure 4. Examples of the patient-specific model rendered with matched BRDF surface texture with and without specular highlights. Models incorporating noise-based specular highlights (left column) generally achieved better scoring in visual realism evaluation experiments than those lacking the same effect (right column). [Color version available online.]
![Figure 4. Examples of the patient-specific model rendered with matched BRDF surface texture with and without specular highlights. Models incorporating noise-based specular highlights (left column) generally achieved better scoring in visual realism evaluation experiments than those lacking the same effect (right column). [Color version available online.]](/cms/asset/b11367da-b153-4756-a99a-34990b925f95/icsu_a_202186_f0004_b.jpg)
Figure 5. Example images showing the five different categories used for user evaluation. (1) Unreal; (2) BRDF-low resolution; (3) BRDF; (4) BRDF-Specular; and (5) Real bronchoscope image. [Color version available online.]
![Figure 5. Example images showing the five different categories used for user evaluation. (1) Unreal; (2) BRDF-low resolution; (3) BRDF; (4) BRDF-Specular; and (5) Real bronchoscope image. [Color version available online.]](/cms/asset/30021830-cdb9-4f6a-aef4-ffc848d871c9/icsu_a_202186_f0005_b.jpg)
Figure 6. The average visual assessment score for all the images of each category across all participants in the naïve and expert groups (error bars show one standard deviation). [Color version available online.]
![Figure 6. The average visual assessment score for all the images of each category across all participants in the naïve and expert groups (error bars show one standard deviation). [Color version available online.]](/cms/asset/ab40af07-9f65-410d-8814-57165cd7a628/icsu_a_202186_f0006_b.jpg)
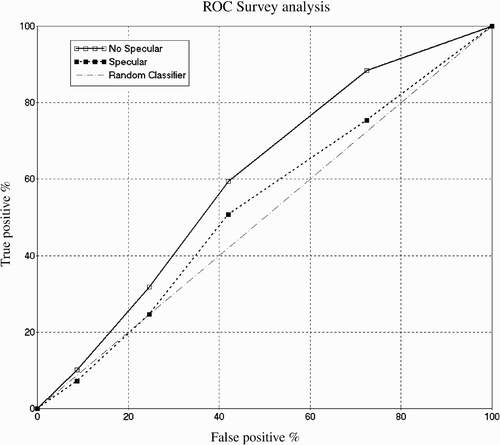
Figure 7. The ROC curves for different classes of images. Images without specular highlights are more easily spotted as synthetic. It can also be seen that observers had significantly more difficulty with the specular images and performed only marginally better than a random classifier, thus illustrating the visual realism achieved by the method proposed in this paper.
