Figures & data
Figure 1. Initial (blue) and deformed (red) configurations. (a) The initial configuration of a catheter could be curved. Thus, for each beam, we store an initial displacement based on the position of the tip node in the local frame of the base node. (b) Actual deformations can always be measured locally in the local reference frame using
. Displacements from initial configuration to deformed configuration are measured using u in the global reference frame and by
in the local frame. [Color version available online.]
![Figure 1. Initial (blue) and deformed (red) configurations. (a) The initial configuration of a catheter could be curved. Thus, for each beam, we store an initial displacement based on the position of the tip node in the local frame of the base node. (b) Actual deformations can always be measured locally in the local reference frame using . Displacements from initial configuration to deformed configuration are measured using u in the global reference frame and by in the local frame. [Color version available online.]](/cms/asset/7657add8-0eef-4d76-a5a0-b0aaf589a97f/icsu_a_209006_f0001_b.jpg)
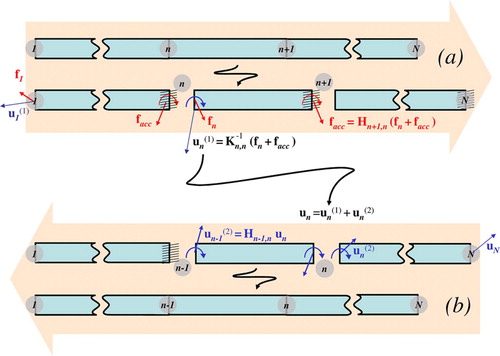
Figure 2. (a) Setting boundary conditions: the object is split into a series of substructures, and local displacements and force facc are computed after constraining the boundary node of each substructure. (b) Relaxing boundary conditions: correction displacements
are applied recursively, starting from node N, at each internal node of each substructure.
Algorithm 1: System solving using substructure analysis
Algorithm 2: Flexibility computation using substructure analysis
Algorithm 3: Signorini law
Figure 3. Catheter navigation inside the cerebrovascular network. Complex, non-linear deformations are correctly represented by the incremental FEM model. Collision detection and collision response allow the catheter to remain within the lumen of the vessels.
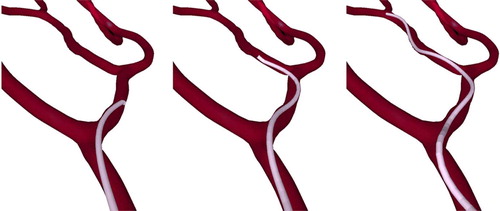
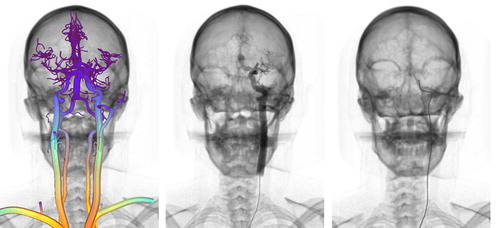
Figure 4. Left: Color-coded vascular model obtained from patient data; warmer colors correspond to increased blood flow. Center: Contrast agent injection using particle-based rendering. Right: Real-time catheter navigation and fluoroscopic rendering.
Algorithm 4: Substructure Gauss-Seidel algorithm