Figures & data
Figure 1. Graphical user interface of the integrated software system.
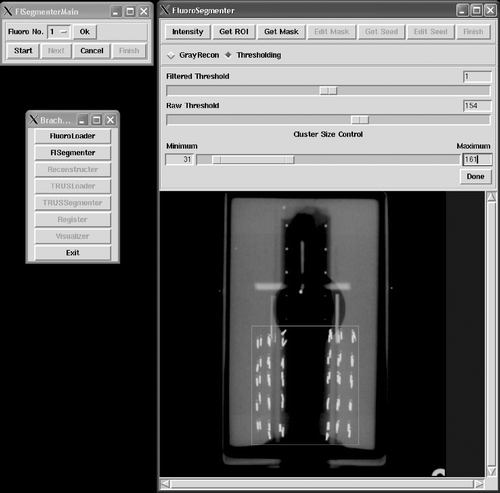
Figure 2. Workflow of the fluoroscopy-TRUS fusion-based dose analysis for PPB.
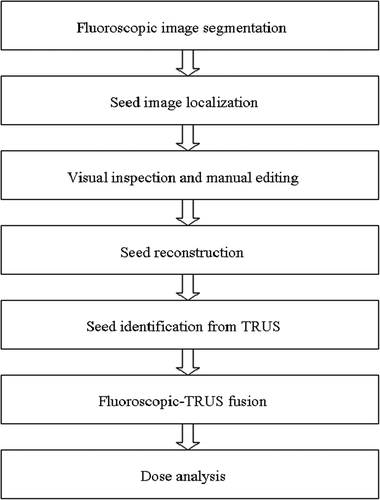
Figure 3. A photograph of the prostate phantom with implanted non-radioactive seeds.
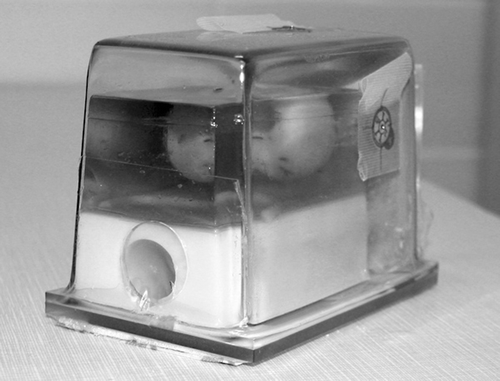
Figure 4. (a) Original radiograph of a patient implant. (b) Automatic segmentation result using morphological techniques without size analysis. (c) Result from (b) after size analysis and manual editing. (d) Filtered image using the predefined point spread function (PSF). (e) Segmentation result by interactive thresholding of both (a) and (d). (f) Result after size analysis and manual editing.
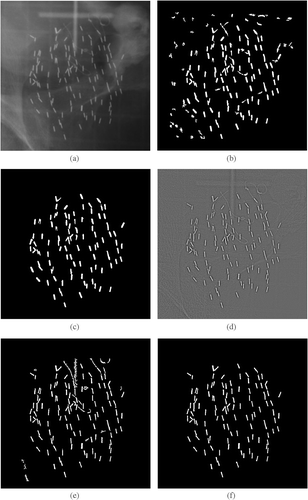
Figure 5. Reconstructed seed locations (×) compared with “gold standard” CT seed locations (o) at registration.
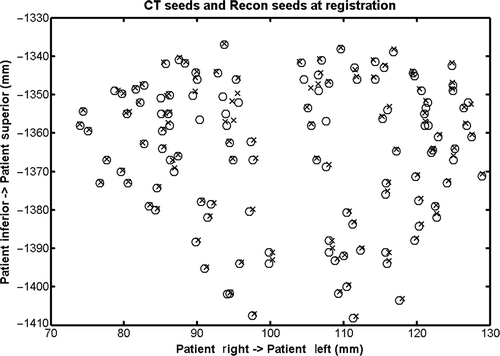
Table I. Dosimetry parameters calculated using the image-fusion-based approach and compared to the results from CT-based dosimetry for the simulation study. Prostate D90 is the minimum dose delivered to 90% of the prostate volume; Prostate D50 is the minimum dose delivered to 50% of the prostate volume; and V parameters are the volume of the corresponding anatomical structure that is exposed to the noted percentage dose. For example, Prostate V150 is the volume of the prostate that was exposed to 150% of the prescribed dose. In this particular case, the prescribed dose was 145 Gy.
Figure 6. An example of a fluoroscopic image of the phantom (a) and the reconstructed seed locations (b).
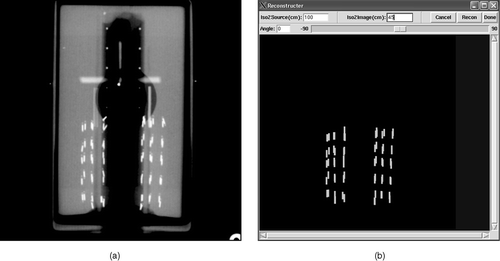
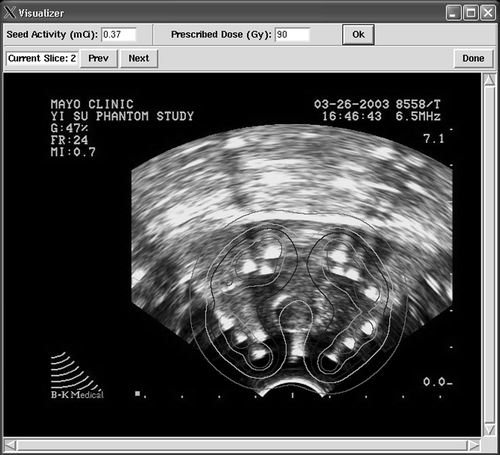
Figure 7. Isodose contours superimposed on the TRUS image at registration.