Figures & data
Figure 1. Surgical navigation system setup. Left: The SurgiGATE® navigation system. Top right: The optoelectronically trackable C-arm. Bottom right: Surgical tools including the dynamic reference base (DRB), chisel, gravity device, and pointers. [Color version available online.]
![Figure 1. Surgical navigation system setup. Left: The SurgiGATE® navigation system. Top right: The optoelectronically trackable C-arm. Bottom right: Surgical tools including the dynamic reference base (DRB), chisel, gravity device, and pointers. [Color version available online.]](/cms/asset/3d914a03-7d12-4f19-96f5-cfe99e9fb840/icsu_a_255148_f0001_b.gif)
Figure 2. Fluoroscopy image-based intra-operative planning of the graft bed. (a) Four deep-seated landmarks (displayed as two red spheres and two yellow spheres) which locate the four corners of the graft bed in the cranial-ventral, caudal-ventral, cranial-dorsal, and caudal-dorsal directions, respectively, are acquired with a bi-planar landmark reconstruction technique and used to guide the planning. (b) The surgeon can interactively adjust the position and orientation of the virtual graft bed model by comparing the projection of the graft bed model with the underlying anatomical images. [Color version available online.]
![Figure 2. Fluoroscopy image-based intra-operative planning of the graft bed. (a) Four deep-seated landmarks (displayed as two red spheres and two yellow spheres) which locate the four corners of the graft bed in the cranial-ventral, caudal-ventral, cranial-dorsal, and caudal-dorsal directions, respectively, are acquired with a bi-planar landmark reconstruction technique and used to guide the planning. (b) The surgeon can interactively adjust the position and orientation of the virtual graft bed model by comparing the projection of the graft bed model with the underlying anatomical images. [Color version available online.]](/cms/asset/d0ba0f4c-69ce-44fd-ac15-17277297e4c2/icsu_a_255148_f0002_b.gif)
Figure 4. Resection of the volume of the vertebral body as previously planned. The instrument is inside the resection volume. [Color version available online.]
![Figure 4. Resection of the volume of the vertebral body as previously planned. The instrument is inside the resection volume. [Color version available online.]](/cms/asset/334e6d63-0235-40db-9ebd-dd1dc579781f/icsu_a_255148_f0004_b.gif)
Figure 5. Resection of the volume of the vertebral body as previously planned. The instrument is outside the resection volume. [Color version available online.]
![Figure 5. Resection of the volume of the vertebral body as previously planned. The instrument is outside the resection volume. [Color version available online.]](/cms/asset/1b5f2036-b43e-495b-bb18-a1bb15e84aa9/icsu_a_255148_f0005_b.gif)
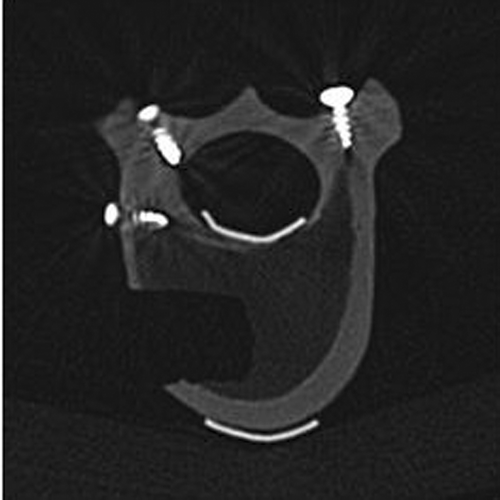
Figure 6. A slice of the post-operative CT scan, showing the formed graft bed and the fiducial markers.

Figure 7. The landmarks extracted from the formed graft bed and the planned graft bed for accuracy evaluation in one specimen (number A4). Colored spheres represent those landmarks extracted from CT volume data and transformed to the dynamic reference base (DRB) space using paired-point registration transformation. The rectangle represents the planned 3D graft bed in the DRB space as determined with our fluoroscopy-based planning and navigation system. [Color version available online.]
![Figure 7. The landmarks extracted from the formed graft bed and the planned graft bed for accuracy evaluation in one specimen (number A4). Colored spheres represent those landmarks extracted from CT volume data and transformed to the dynamic reference base (DRB) space using paired-point registration transformation. The rectangle represents the planned 3D graft bed in the DRB space as determined with our fluoroscopy-based planning and navigation system. [Color version available online.]](/cms/asset/22799d8a-9a8a-4265-a0da-976edb82688a/icsu_a_255148_f0007_b.gif)
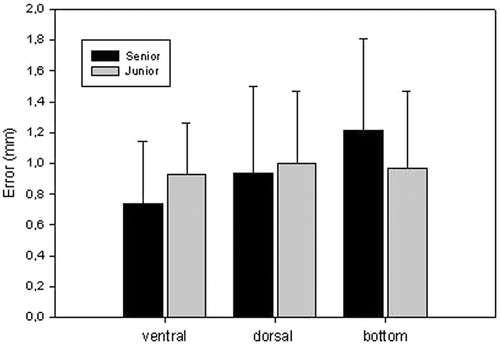
Table I. Accuracy evaluation results. The LM columns show the number of points analyzed in each plane. The bottom row of the table shows the overall average error for the associated plane.

