Figures & data
Figure 1. Overall view of the assembly, showing the positioned leg model with attached reference markers, the fluoroscope with its marker device, the infrared camera, and the touch-screen monitor of the navigation system. [Color version available online.]
![Figure 1. Overall view of the assembly, showing the positioned leg model with attached reference markers, the fluoroscope with its marker device, the infrared camera, and the touch-screen monitor of the navigation system. [Color version available online.]](/cms/asset/189480ae-1cdb-401a-80d6-630425dddd83/icsu_a_288425_f0001_b.gif)
Figure 2. Femoral sawbones with pelvis and tibia fitted into the custom-made, conical, soft synthetic brace. [Color version available online.]
![Figure 2. Femoral sawbones with pelvis and tibia fitted into the custom-made, conical, soft synthetic brace. [Color version available online.]](/cms/asset/0603cbb9-b8cc-4885-8cb7-e845e7bd70c8/icsu_a_288425_f0002_b.gif)
Figure 4. Real-time visualization of drilling on the associated touch-screen. [Color version available online.]
![Figure 4. Real-time visualization of drilling on the associated touch-screen. [Color version available online.]](/cms/asset/a9c9dac1-e99c-408d-ab4b-86bd71f55c8a/icsu_a_288425_f0004_b.gif)
Figure 5. Section through a proximal femur after drilling with the drill left in situ. [Color version available online.]
![Figure 5. Section through a proximal femur after drilling with the drill left in situ. [Color version available online.]](/cms/asset/725bf469-0a24-4b79-ac7d-74d1740f1451/icsu_a_288425_f0005_b.gif)
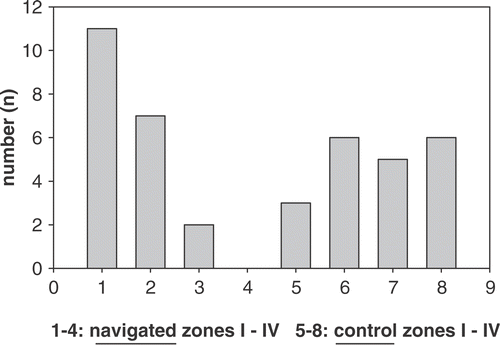
Figure 6. Grouping of results into zones based on distance from the target. Bars 1–4 represent zones I–IV of the navigated group; bars 5–8 represent zones I–IV of the control group.

Table I. Results for navigated group.
Table II. Results for control group.
Table III. Distance of drill from the target (the lesion mid-point).
