Figures & data
Figure 1. CT images (coronal views) corresponding to two different instants in the breathing cycle, end-expiration (a) and end-inspiration (b), and a PET image (c) of the same patient (patient A in our tests). [Color version available online.]
![Figure 1. CT images (coronal views) corresponding to two different instants in the breathing cycle, end-expiration (a) and end-inspiration (b), and a PET image (c) of the same patient (patient A in our tests). [Color version available online.]](/cms/asset/4b7dbe9d-8239-4fc4-97f3-cb5aebcce607/icsu_a_343366_f0001_b.gif)
Figure 2. Non-linear registration without tumor-based constraints. (a) A slice of the original CT image. (b) The corresponding slice in the PET image. (c) The registered PET. The absence of constraints on the tumor deformation leads to undesired and irrelevant deformations of the pathology. In (a), the cursor is positioned on the tumor localization in the CT data, and in (b) and (c) the cursor points to the same coordinates. This example shows an erroneous positioning of the tumor and illustrates the importance of tumor segmentation and the use of tumor-specific constraints during the registration in (c). [Color version available online.]
![Figure 2. Non-linear registration without tumor-based constraints. (a) A slice of the original CT image. (b) The corresponding slice in the PET image. (c) The registered PET. The absence of constraints on the tumor deformation leads to undesired and irrelevant deformations of the pathology. In (a), the cursor is positioned on the tumor localization in the CT data, and in (b) and (c) the cursor points to the same coordinates. This example shows an erroneous positioning of the tumor and illustrates the importance of tumor segmentation and the use of tumor-specific constraints during the registration in (c). [Color version available online.]](/cms/asset/b770caab-d990-46b9-8452-b8de3f72d522/icsu_a_343366_f0002_b.gif)
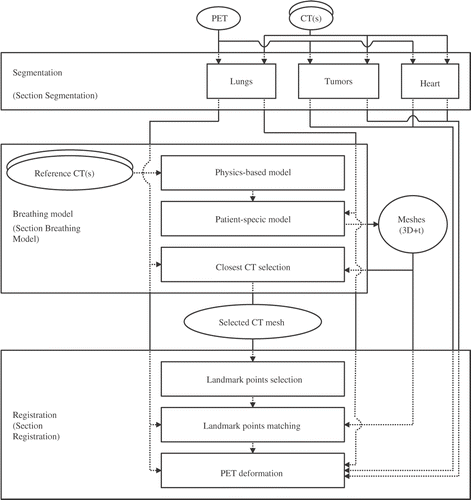
Figure 3. Registration of CT and PET volumes using a breathing model. Segmentations are performed on the volumes, whereas simulation of lung shapes is based on surface meshes. Consequently, the first two steps of the registration process are performed on meshes, while the final step, concerning PET deformations, is computed on the volumes: We obtain a dense registration of the PET volume to the original CT volume.

Figure 5. Results of automatic heart segmentation (green contour) for two cases where a tumor (red contour) is present in the right (a, b) and left (c, d) lungs. [Color version available online.]
![Figure 5. Results of automatic heart segmentation (green contour) for two cases where a tumor (red contour) is present in the right (a, b) and left (c, d) lungs. [Color version available online.]](/cms/asset/8cefff91-5d07-49fb-9530-fdd9d26d01ec/icsu_a_343366_f0005_b.gif)
Figure 6. The physics-based breathing model. (a) depicts the pressure-volume relation, and (b) and (c) are two meshes of the breathing model obtained with the reference 4D CTs. (b) is the end-expiration mesh, and (c) is the end-inspiration mesh. This is the initial breathing model (based on a reference image) before any adaptation to a specific patient. [Color version available online.]
![Figure 6. The physics-based breathing model. (a) depicts the pressure-volume relation, and (b) and (c) are two meshes of the breathing model obtained with the reference 4D CTs. (b) is the end-expiration mesh, and (c) is the end-inspiration mesh. This is the initial breathing model (based on a reference image) before any adaptation to a specific patient. [Color version available online.]](/cms/asset/512174b6-4940-40a7-b95e-6b2dea9c2aa6/icsu_a_343366_f0006_b.gif)
Figure 7. Three simulated CTs for one patient (patient A in our tests), representing two intermediate points (a and b) and the end-inspiration (c). The red crosses are on the same 3D points in each volume. [Color version available online.]
![Figure 7. Three simulated CTs for one patient (patient A in our tests), representing two intermediate points (a and b) and the end-inspiration (c). The red crosses are on the same 3D points in each volume. [Color version available online.]](/cms/asset/ba3876e1-9754-484e-8cd3-8232feb58266/icsu_a_343366_f0007_b.gif)
Figure 8. Selection of landmark points on the same axial view of the lung (patient B in our tests). In each image, two regions of interest are identified with two rectangles. In the large rectangle, there is no landmark point with the GAU method (b), whereas there are four landmark points with the MEA method (a). In the fusion MEA-GAU method (c), these landmark points are selected. In the small rectangle, no landmark point is selected with the mean and/or the Gaussian curvatures (a-c). However, a landmark point is added in this area with the MEA-GAU-UNI method (d). This example illustrates the selected landmark points on one slice, but the selection has been computed on the volume. For this reason, no voxel has been selected in the left flat region, i.e., a voxel has been selected in a close slice.

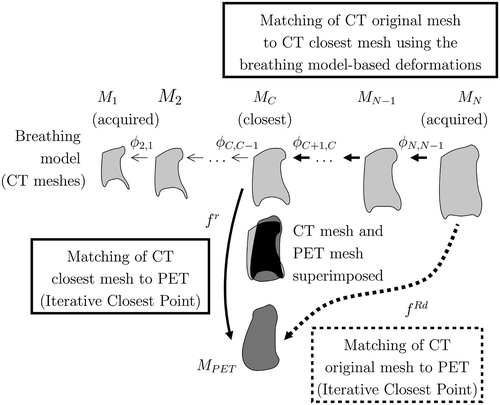
Figure 9. Matching framework of the PET (MPET) and the original CT (MN): The MC mesh is the closest to the MPET mesh. We can match landmark points between MPET and MN by following one of the two paths. The proposed method corresponds to the bold line.

Figure 10. Illustration of the influence of the distance to the rigid objects (black ellipses) in the non-linear deformation. Two different positions of a point t (one close to and one far from the rigid objects) are shown, and two points of interest are represented by tj and tk. When a point of interest is close to a rigid object, like tk, it has little influence in the non-linear term in Equation 6 (cf. Equation 10). When the point t is close to one of the rigid objects (like the t at the bottom of the figure), its influence in the non-linear term is also reduced. [Color version available online.]
![Figure 10. Illustration of the influence of the distance to the rigid objects (black ellipses) in the non-linear deformation. Two different positions of a point t (one close to and one far from the rigid objects) are shown, and two points of interest are represented by tj and tk. When a point of interest is close to a rigid object, like tk, it has little influence in the non-linear term in Equation 6 (cf. Equation 10). When the point t is close to one of the rigid objects (like the t at the bottom of the figure), its influence in the non-linear term is also reduced. [Color version available online.]](/cms/asset/0c5c1c77-85ed-4a5f-8068-98e8153309da/icsu_a_343366_f0010_b.gif)
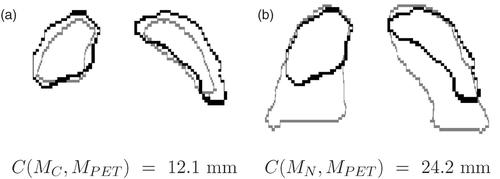
Figure 11. Superimposition of the contours for the same coronal slice in the PET (black contour) and two CTs (grey contour) at two instants in the breathing cycle in patient B: (a) the closest to the PET (MC), and (b) end-inspiration (MN). The criterion C corresponds to the root mean square distance.

Figure 12. Original PET (a) and CT (d and g) images in a normal case (patient A). Correspondences between selected points in a PET image and an end-inspiration CT image (g) are shown in (b) for the direct method, in (e) for the method with the breathing model and a non-uniform landmark points detection, and in (h) for the method with the breathing model and a pseudo-uniform landmark points selection (corresponding points are linked). PET data is shown in (c) with the direct method, in (f) with the method using the breathing model with a non-uniform landmark points distribution, and in (i) with the method using the breathing model and landmark points pseudo-uniformly distributed. The fourth row of images shows registration details on the bottom part of the right lung in a normal case: (j) is the end-inspiration CT; (k) shows PET data registered without the breathing model; and (l) shows PET data registered with the breathing model. The white crosses correspond to the same coordinates. The method using the breathing model provides a better registration of the lung surfaces. [Color version available online.]
![Figure 12. Original PET (a) and CT (d and g) images in a normal case (patient A). Correspondences between selected points in a PET image and an end-inspiration CT image (g) are shown in (b) for the direct method, in (e) for the method with the breathing model and a non-uniform landmark points detection, and in (h) for the method with the breathing model and a pseudo-uniform landmark points selection (corresponding points are linked). PET data is shown in (c) with the direct method, in (f) with the method using the breathing model with a non-uniform landmark points distribution, and in (i) with the method using the breathing model and landmark points pseudo-uniformly distributed. The fourth row of images shows registration details on the bottom part of the right lung in a normal case: (j) is the end-inspiration CT; (k) shows PET data registered without the breathing model; and (l) shows PET data registered with the breathing model. The white crosses correspond to the same coordinates. The method using the breathing model provides a better registration of the lung surfaces. [Color version available online.]](/cms/asset/5e902842-92d3-4dc5-9c23-70097ab856fd/icsu_a_343366_f0012_b.gif)
Figure 13. Original PET (a) and CT (d and g) images in a pathological case (patient B: the tumor is surrounded by a white circle). The correspondences between the selected points in the PET image and the end-inspiration CT image (g) are shown in (b) for the direct method, in (e) for the method with the breathing model and a non-uniform landmark points detection, and in (h) for the method with the breathing model and a pseudo-uniform landmark points selection (corresponding points are linked). Registered PET is shown in (c) for the direct method, in (f) for the method with the breathing model with a non-uniform landmark point distribution, and in (i) for the method with the breathing model and landmark points pseudo-uniformly distributed. In panels (e) and (h) it can be observed that landmark points are better distributed with a uniform selection. The fourth row shows registration details in the region between the lungs in a pathological case: (j) is the end-inspiration CT; (k) is the PET registered without the breathing model; and (l) is the PET registered with the breathing model. The white crosses correspond to the same coordinates. The method using the breathing model avoids unrealistic deformations in this region. [Color version available online.]
![Figure 13. Original PET (a) and CT (d and g) images in a pathological case (patient B: the tumor is surrounded by a white circle). The correspondences between the selected points in the PET image and the end-inspiration CT image (g) are shown in (b) for the direct method, in (e) for the method with the breathing model and a non-uniform landmark points detection, and in (h) for the method with the breathing model and a pseudo-uniform landmark points selection (corresponding points are linked). Registered PET is shown in (c) for the direct method, in (f) for the method with the breathing model with a non-uniform landmark point distribution, and in (i) for the method with the breathing model and landmark points pseudo-uniformly distributed. In panels (e) and (h) it can be observed that landmark points are better distributed with a uniform selection. The fourth row shows registration details in the region between the lungs in a pathological case: (j) is the end-inspiration CT; (k) is the PET registered without the breathing model; and (l) is the PET registered with the breathing model. The white crosses correspond to the same coordinates. The method using the breathing model avoids unrealistic deformations in this region. [Color version available online.]](/cms/asset/5c0e9f8a-99d3-45e8-a8d7-641cf9a65113/icsu_a_343366_f0013_b.gif)
Table I. Quantitative results for a normal case and a pathological case (FP: false positives; FN: false negatives; IUR: Intersection/union ratio; SIM: similarity index; SEN: sensitivity; SPE: specificity; Mean: mean distance; RMS: root mean square distance, cf. Criteria sub-section). We compare the results obtained without the breathing model, with non-uniform selection, denoted as NOBM-NOUNI, and uniform selection, denoted as NOBM-UNI, and with the breathing model, with non-uniform selection, denoted as BM-NOUNI, and uniform selection, denoted as BM-UNI. Bold results indicate best results for each criterion and each case. The breathing-model version with uniform selection provided the lowest errors based on several criteria.
