4,039
Views
91
CrossRef citations to date
0
Altmetric
Research Article

Assessment of optical localizer accuracy for computer aided surgery systems

, MBA, &
Pages 1-12 | Received 17 Feb 2009, Accepted 16 Jan 2010, Published online: 17 Mar 2010

Figures & data

Figure 1. Setup of the camera systems on the CMM.

Figure 1. Setup of the camera systems on the CMM.

Figure 2. The seven test lengths for the evaluation of the Length Measurement Error.

Figure 2. The seven test lengths for the evaluation of the Length Measurement Error.

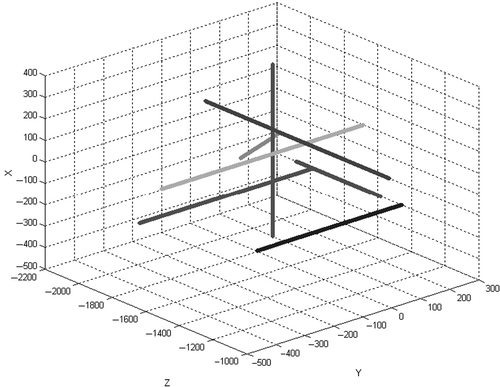
Figure 3. Configurations of the four pointers and two reference frames used to estimate clinical accuracy.
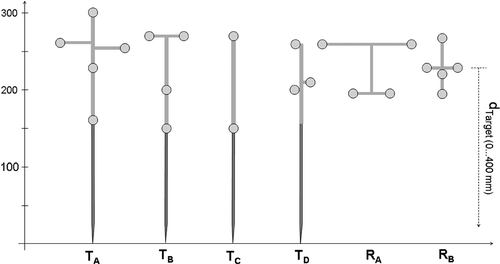
Figure 3. Configurations of the four pointers and two reference frames used to estimate clinical accuracy.

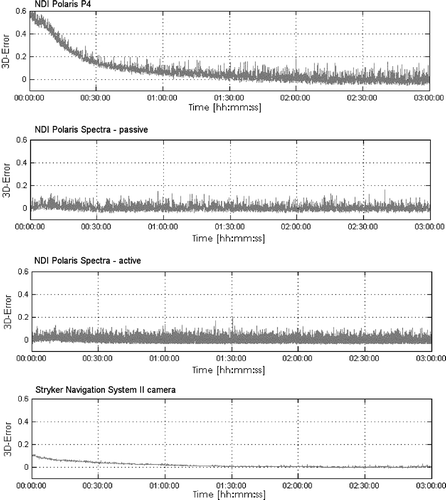
Figure 4. Static measurements: chronological sequence (hh:mm:ss) of 3D error (mm).

Figure 4. Static measurements: chronological sequence (hh:mm:ss) of 3D error (mm).

Table I.  Results of the relative static measurements. Warm-up time was defined as the time after which no value differed by more than 0.1 mm from the mean value for the final 30 min of the measurement period.

Figure 5. Volumetric single marker measurements: volumetric distribution of trueness throughout the measurement volume.
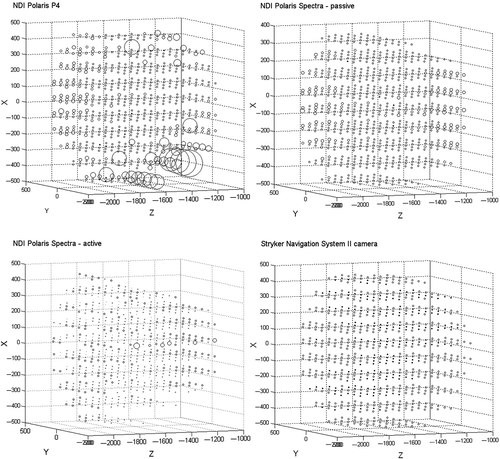
Figure 5. Volumetric single marker measurements: volumetric distribution of trueness throughout the measurement volume.

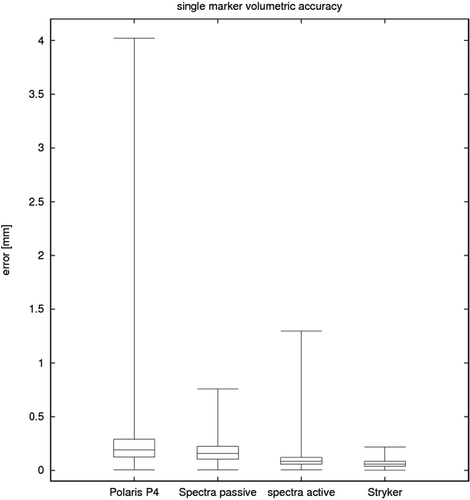
Figure 6. Error distribution of single marker volumetric measurements.

Figure 6. Error distribution of single marker volumetric measurements.

Table II.  Results of the volumetric single marker measurement.

Figure 7. Length Measurement Error: LME diagram (upper portion of each quarter) and histogram of LMEs.
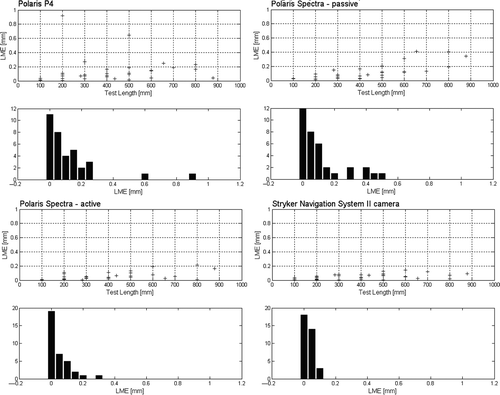
Figure 7. Length Measurement Error: LME diagram (upper portion of each quarter) and histogram of LMEs.

Table III.  Results of the Length Measurement Error evaluation.

Figure 8. Volumetric tool measurements: volumetric distribution of trueness throughout the measurement volume.
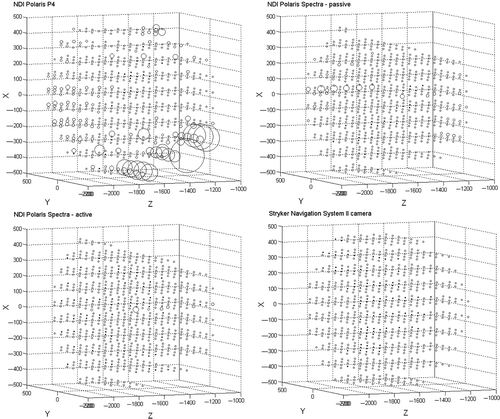
Figure 8. Volumetric tool measurements: volumetric distribution of trueness throughout the measurement volume.

Table IV.  Results of the volumetric tool measurements: translation.

Table V.  Results of the volumetric tool measurements: rotation.
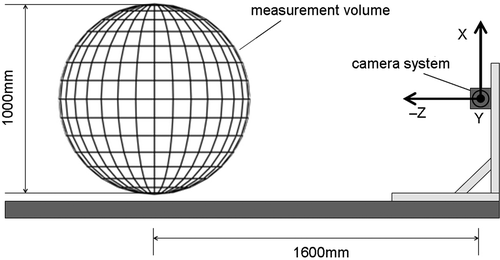
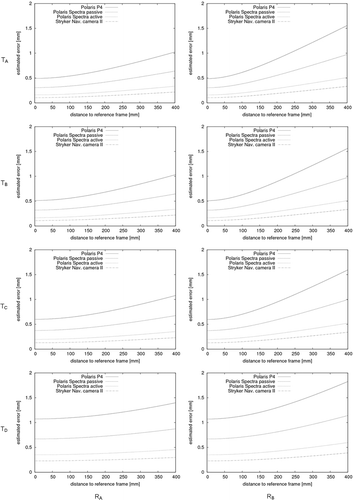
Figure 9. Estimation of the clinical accuracy of different tool/reference configurations for a tool-tip distance of 1 to 400 mm from the center of gravity of the reference frame.

Figure 9. Estimation of the clinical accuracy of different tool/reference configurations for a tool-tip distance of 1 to 400 mm from the center of gravity of the reference frame.

Reprints and Corporate Permissions

Please note: Selecting permissions does not provide access to the full text of the article, please see our help page How do I view content?

To request a reprint or corporate permissions for this article, please click on the relevant link below:

Academic Permissions

Please note: Selecting permissions does not provide access to the full text of the article, please see our help page How do I view content?

Obtain permissions instantly via Rightslink by clicking on the button below:

If you are unable to obtain permissions via Rightslink, please complete and submit this Permissions form. For more information, please visit our Permissions help page.