512
Views
2
CrossRef citations to date
0
Altmetric
Research Article

Towards modeling tumor motion in the deflated lung for minimally invasive ablative procedures

, &
Pages 211-220 | Received 26 Jan 2012, Accepted 25 May 2012, Published online: 16 Aug 2012

Figures & data

Figure 1. Schematic diagram of the proposed image guided minimally invasive system for lung tumor ablative procedures. Pre-operative steps start with acquiring a 4D-CT respiratory sequence along with its corresponding respiration phase data. The 4D-CT sequence is used to construct a CT image of the deflated lung. In conjunction with the respiration phase data, the sequence is also used to quantify the respiratory diaphragm motion. The constructed CT image is initially used for pre-operative treatment planning. It is also used, along with the quantified diaphragm motion, for biomechanical analysis of the lung's respiratory tissue motion and deformation. The resulting tumor motion is then formulated as a function of the respiration phase data. In the intra-operative phase, respiration phase data is acquired using tracked fiducial marker data, and the tumor motion is estimated using the relationships obtained from the proposed model pre-operatively. The estimated tumor motion, along with the constructed CT image of the deflated lung and the treatment plan, can be used as input in the surgical navigation system for accurate operative guidance.

Figure 1. Schematic diagram of the proposed image guided minimally invasive system for lung tumor ablative procedures. Pre-operative steps start with acquiring a 4D-CT respiratory sequence along with its corresponding respiration phase data. The 4D-CT sequence is used to construct a CT image of the deflated lung. In conjunction with the respiration phase data, the sequence is also used to quantify the respiratory diaphragm motion. The constructed CT image is initially used for pre-operative treatment planning. It is also used, along with the quantified diaphragm motion, for biomechanical analysis of the lung's respiratory tissue motion and deformation. The resulting tumor motion is then formulated as a function of the respiration phase data. In the intra-operative phase, respiration phase data is acquired using tracked fiducial marker data, and the tumor motion is estimated using the relationships obtained from the proposed model pre-operatively. The estimated tumor motion, along with the constructed CT image of the deflated lung and the treatment plan, can be used as input in the surgical navigation system for accurate operative guidance.

Figure 2. Result of the CT image construction. (a) Acquired CT image of the totally deflated lung for the purpose of validation. (b) Constructed CT image of the totally deflated lung. Quantitative evaluations performed on the tumor center and its boundaries, as well as on a number of anatomical features (a few of which are indicated by arrows), confirmed a sub-millimetric accuracy for the constructed CT image.
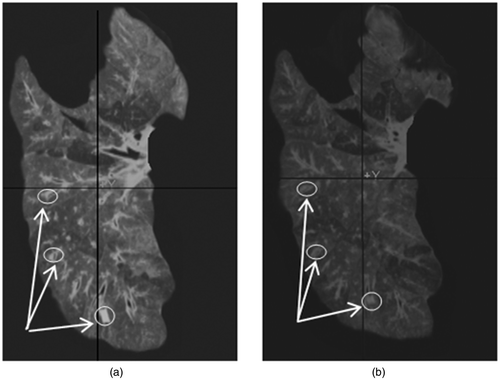
Figure 2. Result of the CT image construction. (a) Acquired CT image of the totally deflated lung for the purpose of validation. (b) Constructed CT image of the totally deflated lung. Quantitative evaluations performed on the tumor center and its boundaries, as well as on a number of anatomical features (a few of which are indicated by arrows), confirmed a sub-millimetric accuracy for the constructed CT image.

Figure 3. Ex vivo experiment conducted for model validation. The projection of the tumor area inside the lung has been tagged on the surface (a) under minimum contact and (b) after displacing the contact surface by 25 mm in the Z direction.
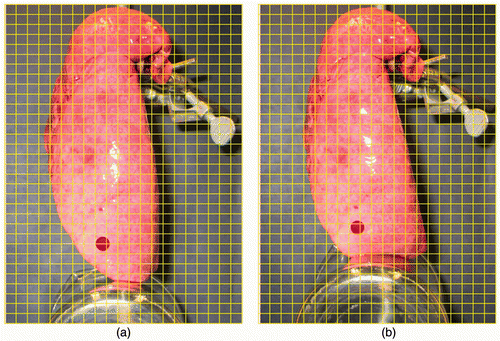
Figure 3. Ex vivo experiment conducted for model validation. The projection of the tumor area inside the lung has been tagged on the surface (a) under minimum contact and (b) after displacing the contact surface by 25 mm in the Z direction.

Figure 4. CT image sequence corresponding to the progressive loading applied to the deflated lung. The tumor slice in each image is outlined by a red circle. The same tumor slice has been tracked and shown throughout the CT image sequence.
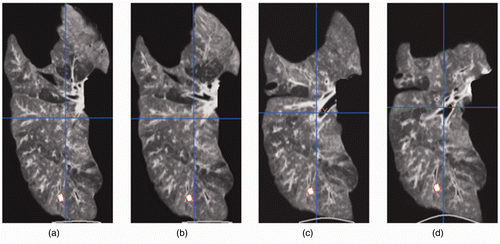
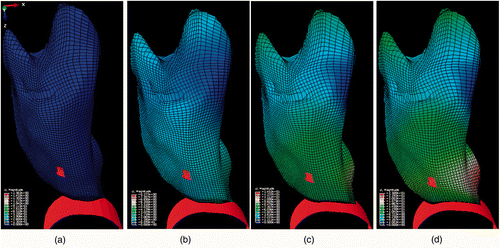
Figure 4. CT image sequence corresponding to the progressive loading applied to the deflated lung. The tumor slice in each image is outlined by a red circle. The same tumor slice has been tracked and shown throughout the CT image sequence.
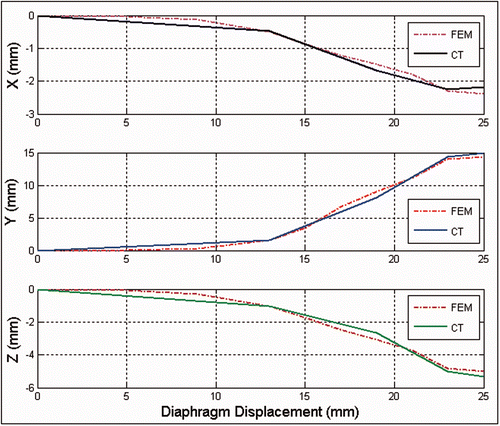
Figure 5. Results of FE simulation. The projection of the tumor area inside the lung is highlighted on the surface. The panels show the undeformed lung (a) together with three samples from the lung deformation field sequence (b–d) for a complete phase of simulated respiration.

Figure 5. Results of FE simulation. The projection of the tumor area inside the lung is highlighted on the surface. The panels show the undeformed lung (a) together with three samples from the lung deformation field sequence (b–d) for a complete phase of simulated respiration.

Figure 6. Graphs showing the 3D tumor trajectory due to lung tissue motion and deformation obtained from the CT sequence in the ex vivo experiment (solid line), as well as that acquired from FE simulation via the proposed pipeline (dashed line).

Figure 6. Graphs showing the 3D tumor trajectory due to lung tissue motion and deformation obtained from the CT sequence in the ex vivo experiment (solid line), as well as that acquired from FE simulation via the proposed pipeline (dashed line).

Reprints and Corporate Permissions

Please note: Selecting permissions does not provide access to the full text of the article, please see our help page How do I view content?

To request a reprint or corporate permissions for this article, please click on the relevant link below:

Academic Permissions

Please note: Selecting permissions does not provide access to the full text of the article, please see our help page How do I view content?

Obtain permissions instantly via Rightslink by clicking on the button below:

If you are unable to obtain permissions via Rightslink, please complete and submit this Permissions form. For more information, please visit our Permissions help page.