Figures & data
Figure 1. Synthetic radiographs with (a) and without (b) the femoral head. Acetabular version was measured using Elliversion. The user can read the version from the upper label.
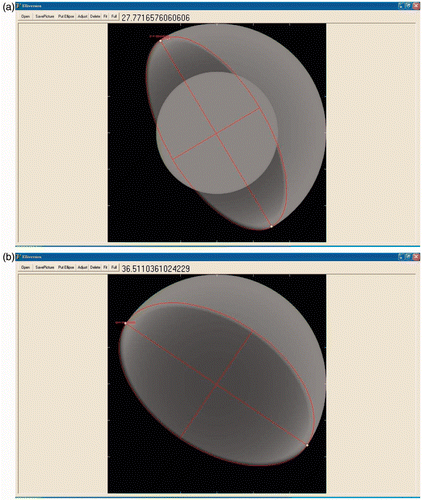
Figure 2. Post-operative radiograph of a United right total hip arthroplasty. Acetabular version was measured using Elliversion.
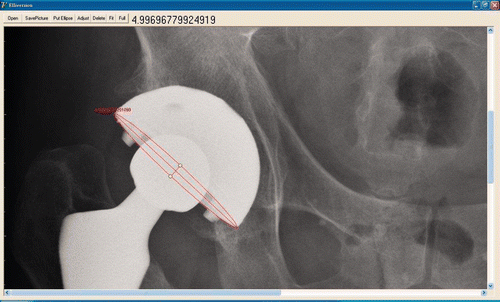
Figure 3. Post-operative radiograph of a United left total hip arthroplasty. Acetabular version was measured using Elliversion. In this case, half of the ellipse is not visible, and we could only assume the shape. This results in a bigger difference between the measurements. We defined radiographs of this kind as poor-quality radiographs.
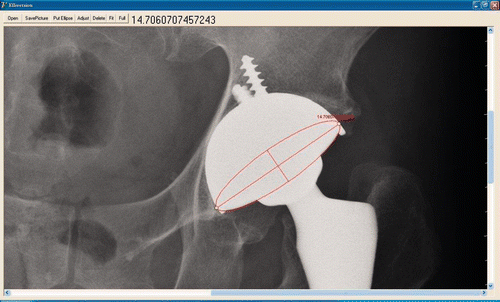
Table I. Absolute error of measurements for synthetic radiographs using the ellipse and trigonometric methods.
Table II. Absolute difference for the repeated measurements.