Figures & data
Figure 1. (a) Clinically established regions of the thoracic aorta. The figure includes the supra-aortic trunks (brachicephalic trunk, left subclavian artery and left common carotid artery) and the visceral trunks (renal arteries, celiac trunk and superior mesenteric artery). (b) Regions of the thoracic aorta segmented using the automatic method.
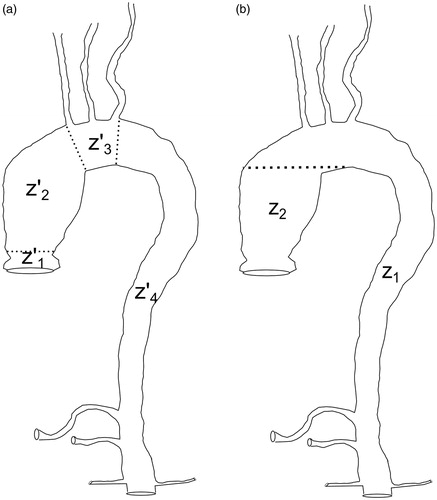
Figure 2. Flowchart of the essential steps in the segmentation of the thoracic aorta.
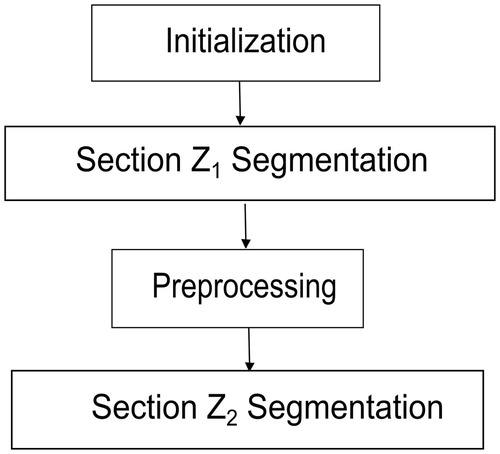
Figure 3. Initialization in the last slice by the Hough transform.
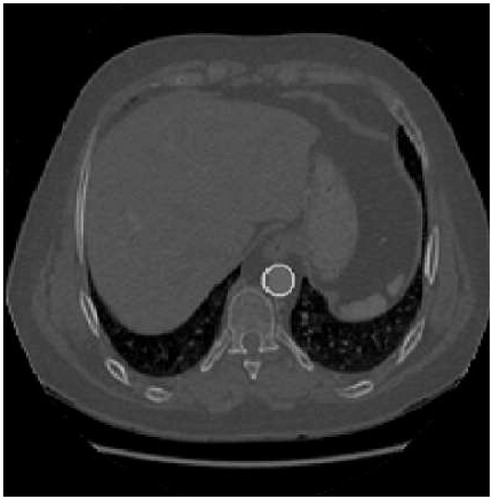
Figure 4. The 17 neighbors considered in the volumetric region-growing technique.
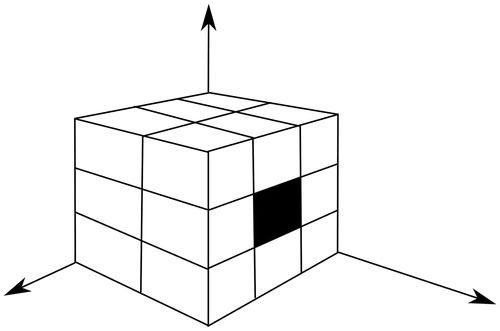
Figure 5. A slice approximated by an ellipse.
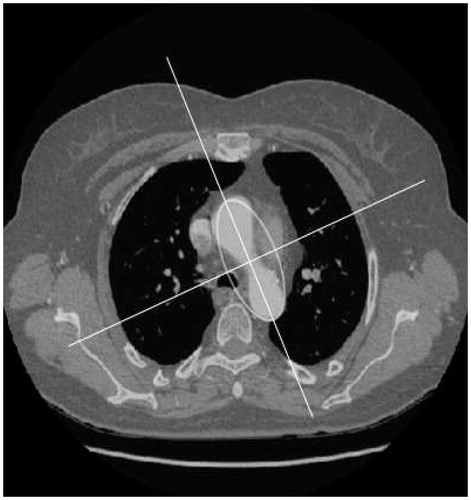
Figure 6. The pre-processing stage to enhance the edges of the image.
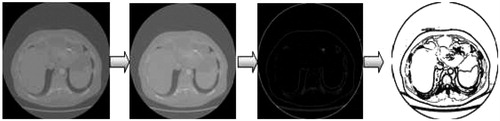
Figure 7. The level-set algorithm.
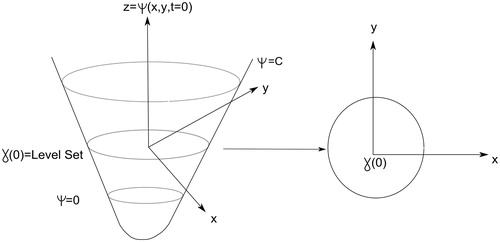
Figure 8. (a) Automatic segmentation of the thoracic aorta with dilatation of the ascending thoracic aorta and elongation of the descending thoracic aorta. (b) Automatic segmentation of a normal thoracic aorta.
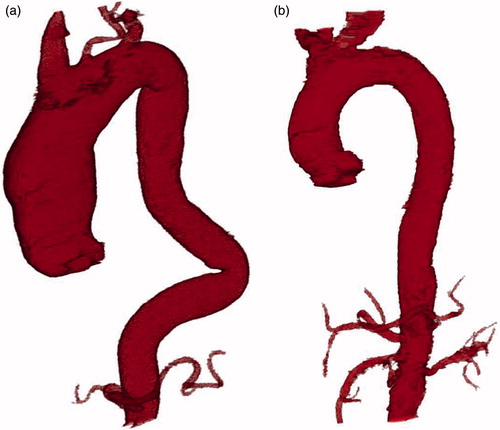
Figure 9. Results obtained in terms of the size of the area segmented.
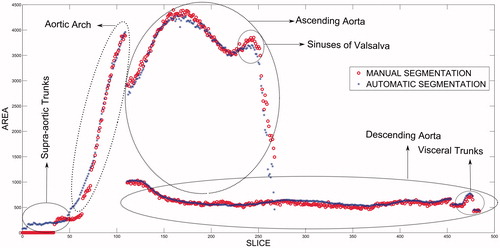
Table I. The Pearson’s correlation coefficient (PCC) for each patient.
Figure 10. Decrease in Dice similarity coefficient in the region near the heart.
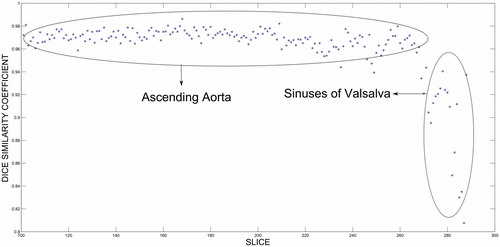
Figure 11. Bland-Altman plot corresponding to the volumes.
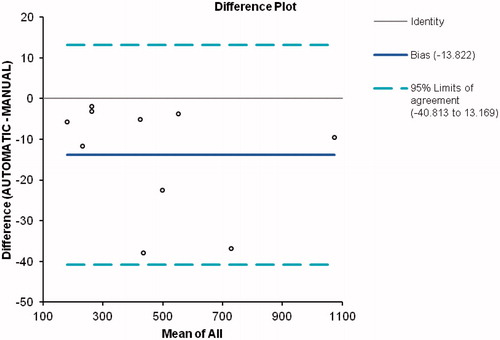
Table II. Descriptive statistics of the Dice similarity coefficient (DSC) for the aorta for the gold standard (manual segmentation) and proposed methods.
Table III. Descriptive statistics of the Dice similarity coefficient (DSC) for the ascending and descending aorta.