Figures & data
Figure 1. The segmented 2D plane based on CT images. The red area indicates segmented hepatic blood vessel.
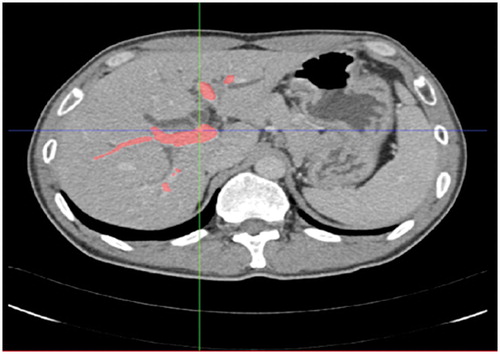
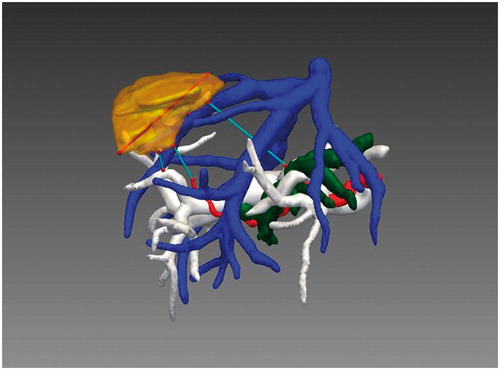
Figure 2. The 3D reconstructed image including the tumor (yellow), portal vein (white), hepatic vein (blue), artery (red) and gall bladder (green).
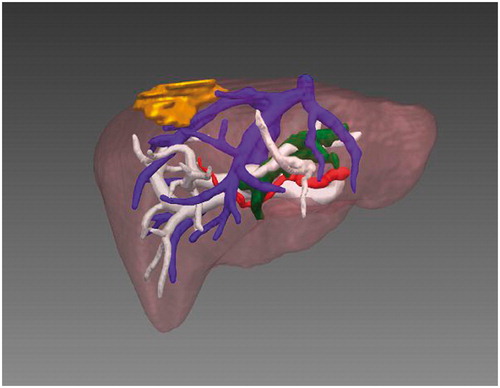
Table I. Comparison of GPU and CPU running times in the computation process.
Figure 3. (a) The anatomical relationship between the tumor and portal vein. (b) The computation results for the tumor’s volume, maximum diameter and minimum distance from tumor to portal vein. On choosing an ROI in (a), the minimum distance from the tumor to that ROI is computed and displayed.
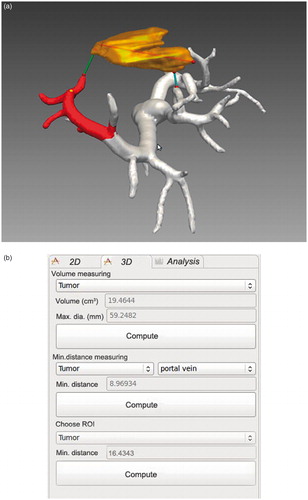
Figure 4. The minimum distance from the tumor to the surrounding vasculature. From the software, distance values from the tumor to the portal vein, hepatic vein, artery and gall bladder were approximately 8.97 mm, 0.23 mm, 17.84 mm and 38.47 mm, respectively.