Figures & data
Figure 1. Diagram presenting the bilateral master-slave teleoperation system with a hybrid parallel force/position control strategy. The system is enhanced by adding an optical force sensor to the end-effector of the slave device. The interaction force between the environment and the slave device is directly measured by the optical sensor.
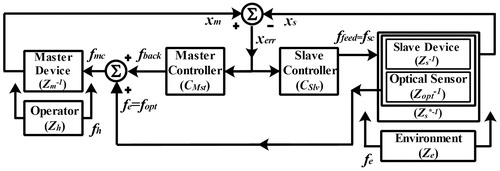
Figure 2. Diagram of the connected teleoperation system controlled by position-error-based (PEB) and direct force reflection (DFR) controllers. In the PEB approach, the difference in position is sent to the both sides with the gain of the controller transfer function, being identical for the master and slave (C1 = C3 = sbc + kc ≡ Cc). In the DFR control strategy, the master measures the hand position (xh) and the slave measures the interaction force (fe), which is subsequently presented to the operator through C2. The combined-control strategy can be expressed in a MIMO framework.
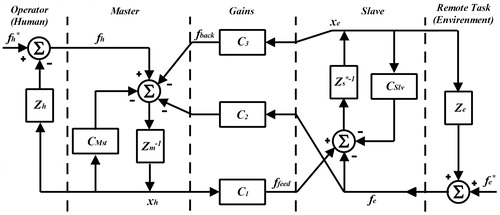
Figure 3. The prototyped optical force sensor, showing the positions of the GRIN-lens fiber-optic collimators, the flexible structure, and the mirror. The body of the sensor consists of a cylindrical flexible structure that converts the applied forces into displacements and vice versa. The GRIN-lens holder and the opposing reflector plate (mirror) are rigidly attached to the ends of the sensor body.
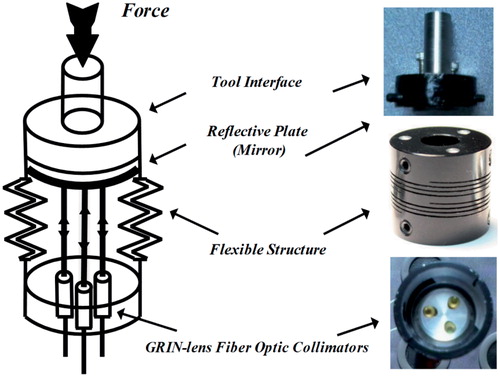
Figure 4. Diagram showing the different parts of the optical force sensing system. The light is demultiplexed to four equal-power signals using a 4-way splitter. Three of the signals are received and transmitted by three GRIN-lens collimators in the sensor unit. The three transmitted signals from the GRIN-lens collimators are received by photodiodes along with the fourth signal as a reference signal. All signals are amplified and sent to a personal computer via a DAQ card.
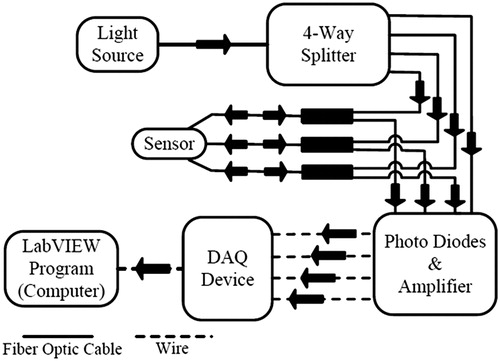
Figure 5. The Gaussian beam distribution profile (25), after leaving a fiber-optic GRIN-lens collimator. The transmitting-receiving light intensity varies as a function of the axial displacement of the reflector. The light travels the distance to the reflector and back to the same collimator. The virtual transmitting-receiving GRIN-lens is assumed to be placed in a mirrored position at 2 h from the real GRIN-lens.
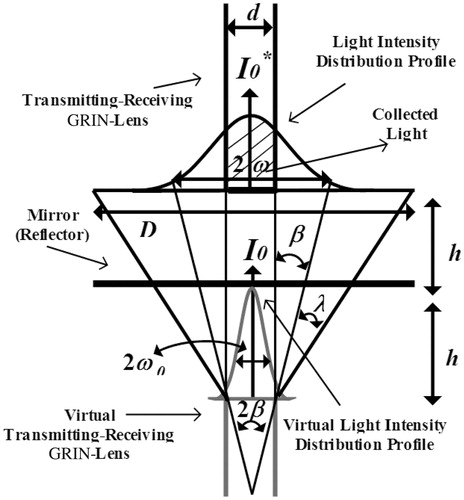
Figure 6. Calibration of the optical force sensor is performed by finding the normalized voltage-deflection curve from experimental results (black curve). This figure also shows the analytical calculation of the voltage-deflection curve using Equation (14) (gray curve) for the operational range of the force sensor. The linear approximation of the experimental voltage-deflection curve (dashed line) shows a reasonable matching between the experimental results (mean = 0.335, σ = 0.036) and the analytical calculation of mathematical model (mean = 0.350, σ = 0.035).
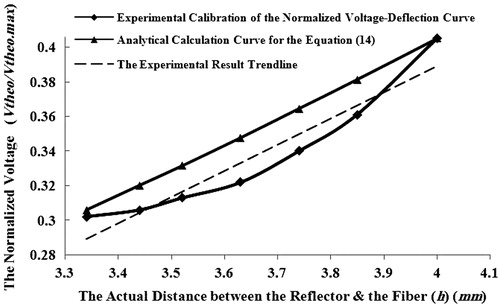
Figure 7. Graph showing the experimental identification results for obtaining the stiffness of the flexible structure of the force sensor. The slope of the curve represents the constant spring (stiffness) of the optical force sensor (9.20 N/mm).
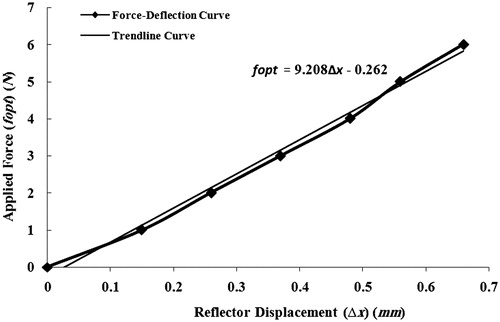
Figure 8. The PHANTOM Omni haptic device as enhanced by addition of the optical force sensor. With this extension, the force sensor acts as a physical mass-spring with unknown stiffness, which is identified experimentally. The extension also changes the kinematics and dynamics of the slave manipulator.
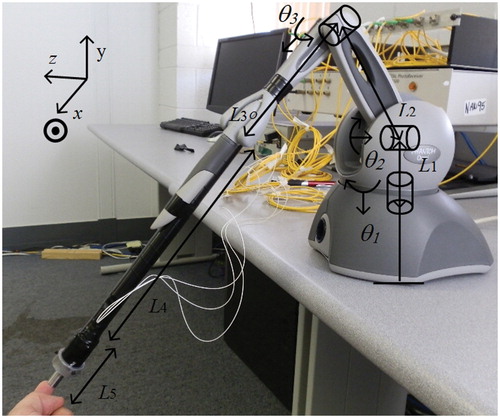
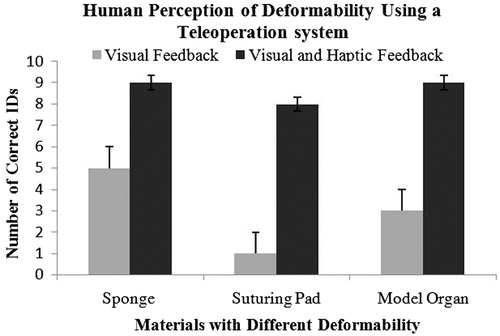
Figure 9. Experiment I: Human subjects’ perception of deformability was quantified for three objects – a sponge, a suturing pad, and a model organ – using a percentage scale.
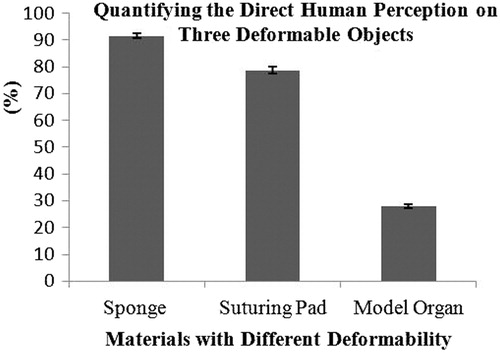
Figure 10. The experimental master-slave set-up to evaluate the performance of the proposed teleoperation system. As the teleoperation task, the subject grasped the end-effector of the master haptic device and examined the deformability of the remote objects on the other side of the room.
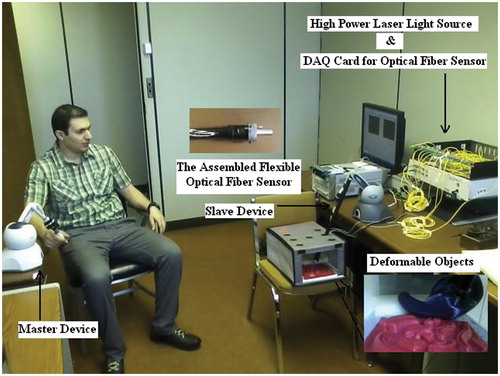
Figure 11. Experiment II: Identification by material of the three deformable objects – a sponge, a suturing pad, and a model organ – with visual feedback alone and with both haptic and visual feedback. The black bars show that the control strategy was able to provide effective force feedback to the subjects, enabling them to identify the deformable objects with a high degree of precision. In other words, in such a human-centered approach, the control parameters are properly tuned based on the quantified deformation of objects as reported by the subjects in the first human factor study.