Figures & data
Figure 1. Bone models in varus with various degrees of deformity.
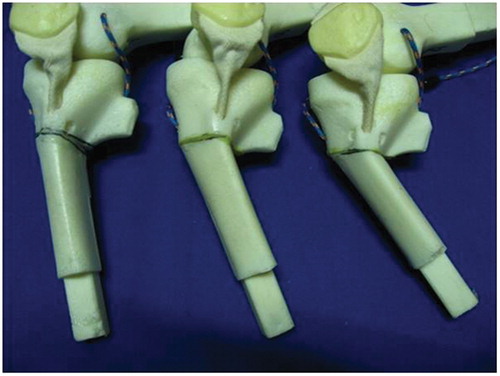
Figure 2. Screenshot from the navigation system showed preoperative alignment of the mechanical axis (29° valgus).
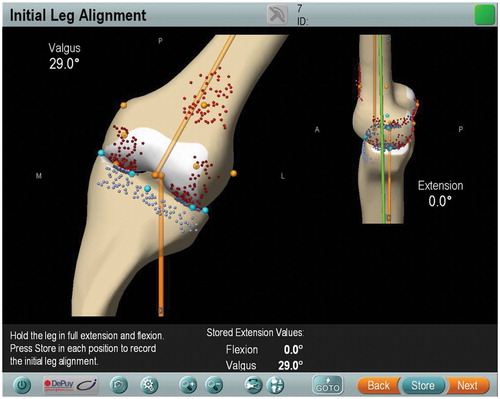
Table I. Angular deformities in all knee models.
Figure 3. The knee insert bone model was fitted into a MITA Knee Trainer Leg workstation. The ball-and-socket joint of the hip in this workstation can pivot freely, allowing the surgeon to find the center of rotation of the hip. During the operation, the knee can move in the sagittal plane until full flexion or extension is attained.
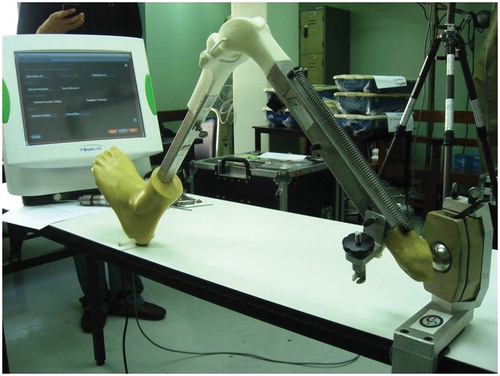
Figure 4. Correlation between the preoperative mechanical axis and the postoperative mechanical axis deviation from neutral in both valgus alignment (a) and varus alignment (b).
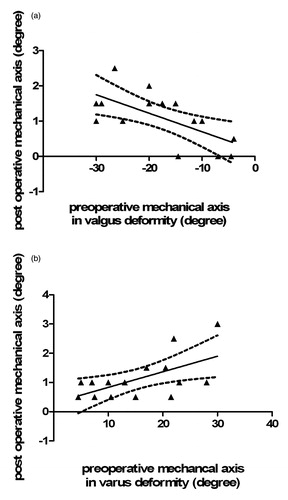
Figure 5. Numbers of outliers were compared for Groups A and B with criteria ranging from ±1° deviation to ±3° deviation from the neutral mechanical axis.
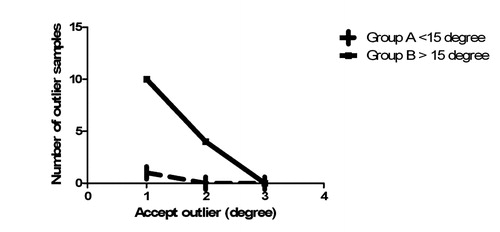
Table II. Mean difference and standard deviation of resected bone measurements using computer navigation and manual measurement with a digital Vernier caliper.
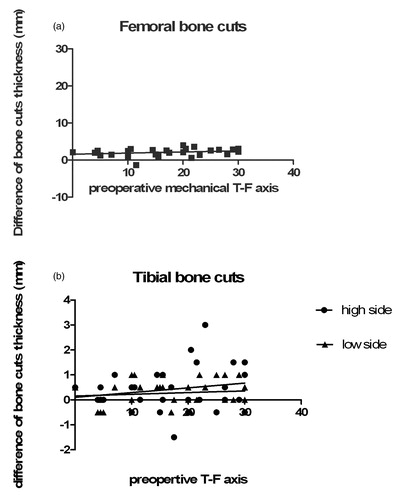
Figure 6. (a) The preoperative mechanical axis and differences in bone cut thickness on the femoral side show no significant correlation (r = 0.27, p = 0.14). (b) There is also no significant correlation on the tibial side at either the high or low side of the bone cuts (high side r = 0.19, p = 0.29; low side r = 0.1181, p = 0.53).