Figures & data
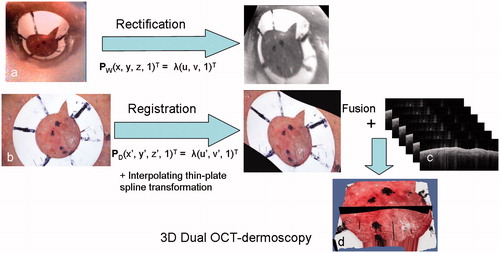
Figure 1. (a) The hand-held OCT probe from the VivoSight 1500 OCT system fitted for this study with a miniature webcam (arrowed), and (b) the Heine Delta 20 dermoscopic attachment to the Nikon DS300 digital camera.
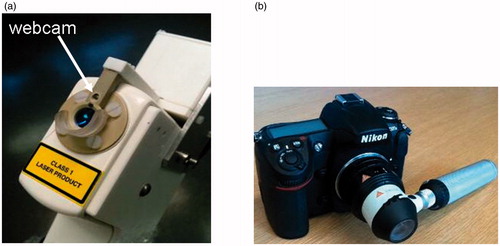
Figure 2. A nodular BCC on the cheek of patient 1 (see ). (a) Clinical image showing the pre-surgical border marked in ink dots on the skin. Inset is the dermoscopy image of the fiducial ring after it has been placed over a small segment of the pre-surgical border in the position indicated by the white circle. (b) Clinical image after one stage of MMS. Extended inked marking indicates the pre-surgical border for the planned second MMS stage. (c) An enlargement of the dermoscopy image of a segment of the lesion border and fiducial marker. (d) The webcam image in the registration before rectification.
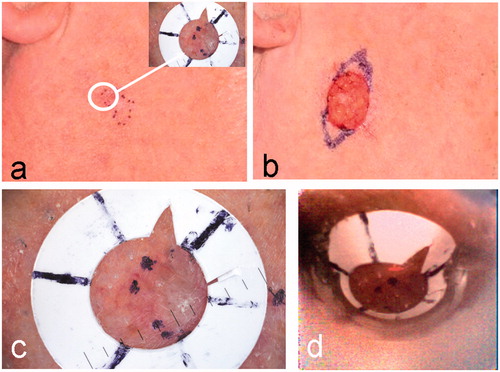
Table I. Comparison of clinical, OCT and final MMS defect borders.
Figure 3. (a) A surface view of the 3D OCT-dermoscopy dataset from a mixed nodular/infiltrative BCC. A clinician-selected plane straddling the clinical border is shown in black. (b) A different view of the 3D dataset showing segments of the pre-surgical border, the OCT-defined border and the final surgical defect as large-dashed, small-dashed and solid lines, respectively. (c) The OCT image from the clinician-selected plane showing ovoid structures interpreted as BCC cell nests (arrowed). The vertical line represents the pre-surgical border and the horizontal line the extent of infiltration of BCC assessed by a dermatologist. The OCT image scale bar corresponds to 1 mm.
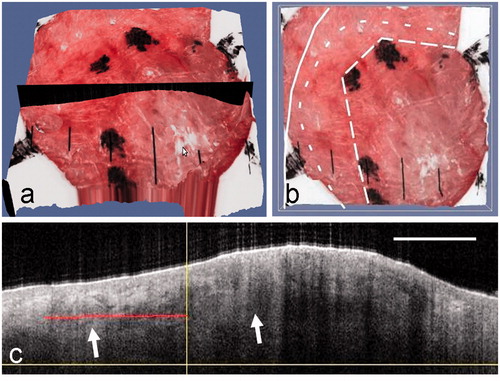
Figure 4. Clinical images of a nodular BCC on the cheek of patient 2 before (a) and after (b) MMS. The dermoscopy image is inset in (a), with the fiducial marker placed across a segment of the pre-surgical border. (c) The selected OCT plane that straddles the clinical border is shown in black on the 3D rendered OCT-dermoscopy image. (d) The pre-surgical border, OCT-defined margin and final MMS defect are superimposed on the 3D rendered image following the line style convention used in . (e) The OCT image corresponding to the selected plane shows a BCC cell nest (left arrow) extending beyond the pre-surgical margin (vertical line). A large cell nest can also be seen largely within the pre-surgical margin (right arrow). The red line indicates the infiltration as assessed from this image. The OCT image scale bar corresponds to 1 mm.
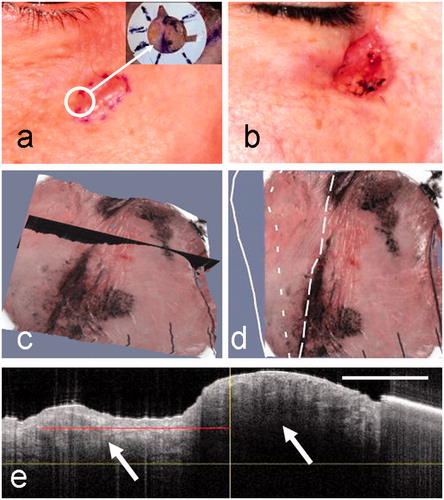
Figure 5. The clinical images of a nodular BCC from patient 3 before (a) and after (b) surgery, showing the clinical border and MMS defect, respectively. The dermoscopy image (inset) shows the fiducial marker in a selected position on a segment of the pre-surgical margin. (c, d) Corresponding 3D rendered dual OCT-dermoscopy images illustrating the selected plane (c) and the position of the clinical border (dotted lines) and surgical defect (black solid line) (d). (e) In this case, the OCT image from the selected plane shows few features of BCC either side of the clinical border apart from a thin epidermis (arrowed) throughout. Artefacts from hairs appear as vertical lines above the skin.
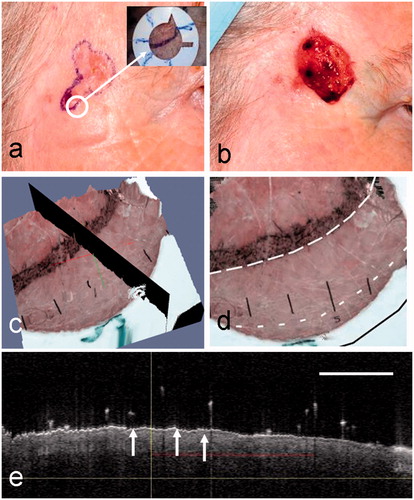
Figure 6. Clinical images of a micronodular BCC from patient 4 before surgery (a) and after surgery showing the MMS defect (b). In this case, the surgeon has marked two borders (a): the clinical border and the normal 2-mm margin around this representing the first MMS stage. The dermoscopy image (inset) shows the fiducial marker in a selected position on a segment of the pre-surgical margin. (c) The OCT image showing normal skin to the right of the clinical border (vertical line) with the DEJ (arrowed). To the left of the clinical border, within the lesion, a single ovoid BCC cell nest may be visible. The clinical and OCT borders are coincident in this case. (d) An enlargement of the dermoscopy image showing the position of the clinical and coincident OCT borders (dotted lines) and the surgical defect (solid white line). (e) The corresponding en face OCT view with the same superimposed borders.
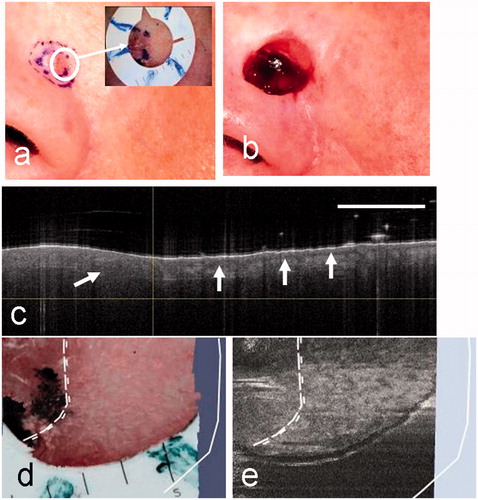
Figure 7. Clinical images of patient 5 before (a) and after (b) surgery for a micronodular BCC. This case shows a particularly large surgical defect relative to the clinical border (black dotted lines). (c) A clinician-selected OCT image straddling the pre-surgical border. In this case the OCT image shows irregularly sized ovoid regions with bright borders (arrowed) and large dark regions (arrowed). These extend throughout the image and well beyond the clinical border (vertical line).
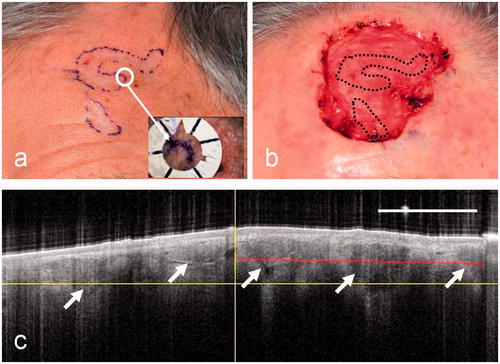
Figure 8. A diagram illustrating the main steps in the algorithm including the rectification of the webcam image of the lesion (a), showing the fiducial marker, and the registration of the dermoscopy image with the rectified webcam image (b), followed by fusion with the OCT image stack (c) to form a 3D combined OCT-dermoscopy image (d).