Figures & data
Figure 1. Clinical case: (A) the left and right CA before surgical intervention and (B) post-operative anatomy – carotid–carotid cross-over bypass.
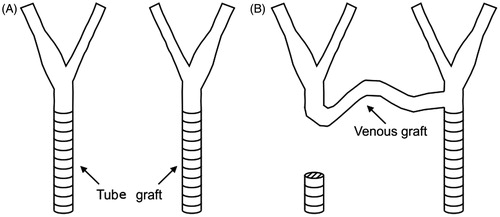
Figure 2. Computed tomography virtualization of the carotid–carotid bypass [Citation6].
![Figure 2. Computed tomography virtualization of the carotid–carotid bypass [Citation6].](/cms/asset/e59e219f-fd6e-45d1-a78f-30a8253d813c/icsu_a_1076036_f0002_c.jpg)
Figure 3. Velocity distribution vector field for the pre- (A) and post-operative (B) case.
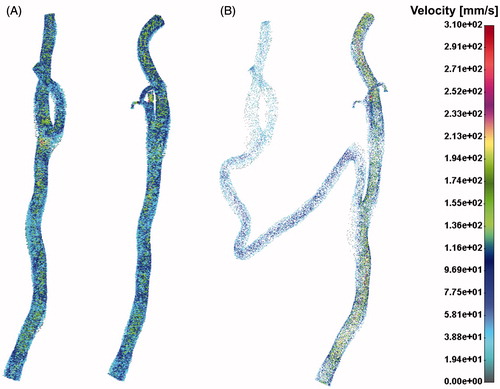
Figure 4. Shear stress distribution field for the pre- (A) and post-operative (B) case.
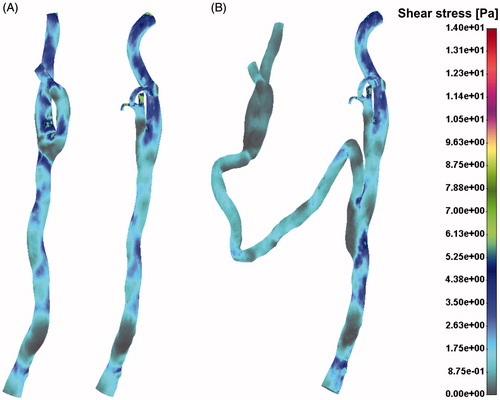
Figure 5. Drag force distribution field for the pre- (A) and post-operative (B) case.
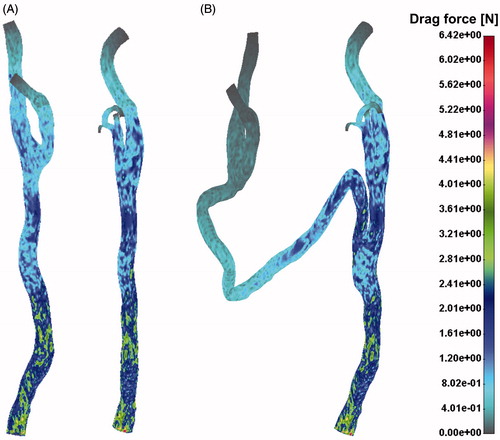
Figure 6. Pressure distribution field for the pre- (A) and post-operative (B) case.
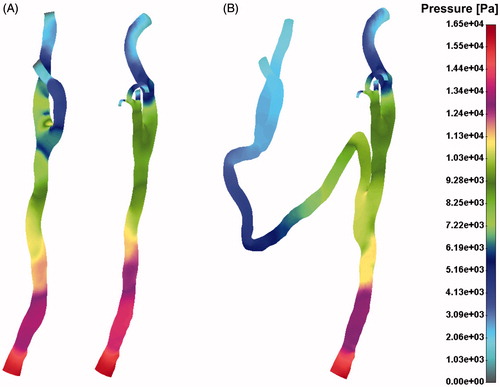
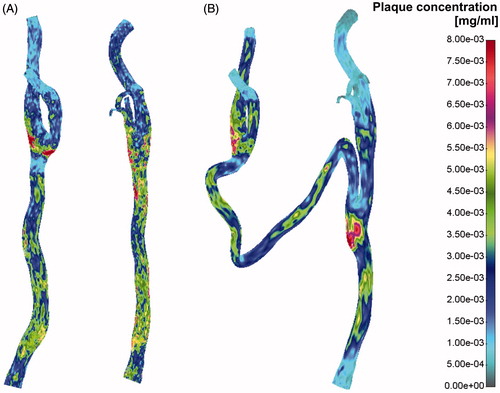
Figure 7. Plaque concentration for the pre- and post-operative case.