Figures & data
Table I. The error during registration of each anatomical landmark using each approach.
Figure 1. Boxplot of the error in the registration of anatomical landmarks in the femur. •: Outliers between ×1.5 and ×3 the interquartile range. *p < 0.05. MIS, minimally invasive approach; STD, standard approach.
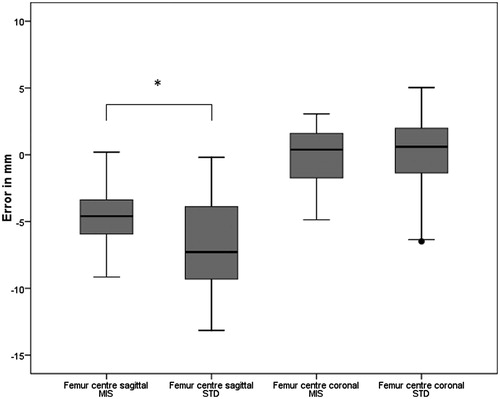
Figure 2. Boxplot of the error in calculation of the mechanical axis of the femur. •: Outliers between ×1.5 and ×3 the interquartile range. *p < 0.05. MIS, minimally invasive approach; STD, standard approach.
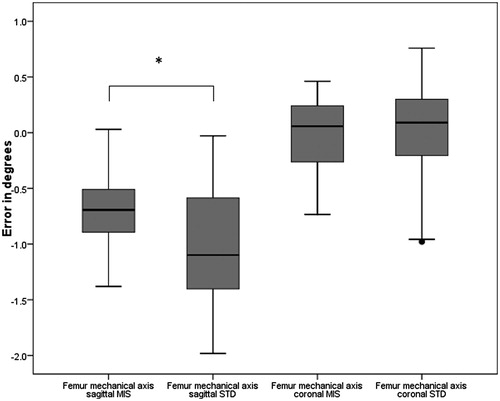
Figure 3. Boxplot of the error in the registration of anatomical landmarks in the tibia and ankle. •: Outliers between ×1.5 and ×3 the interquartile range. *: p < 0.05. MIS, minimally invasive approach; STD, standard approach.
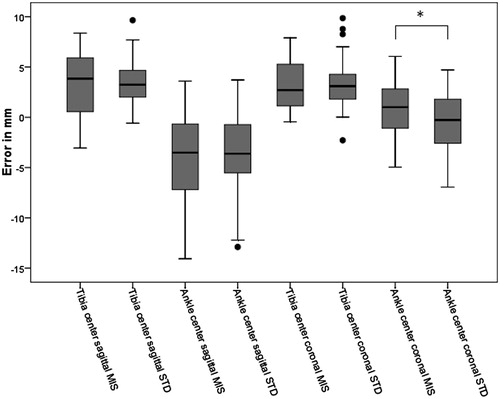
Figure 4. Boxplot of the error in calculation of the mechanical axis of the tibia. •: Outliers between ×1.5 and ×3 the interquartile range. MIS, minimally invasive approach; STD, standard approach.
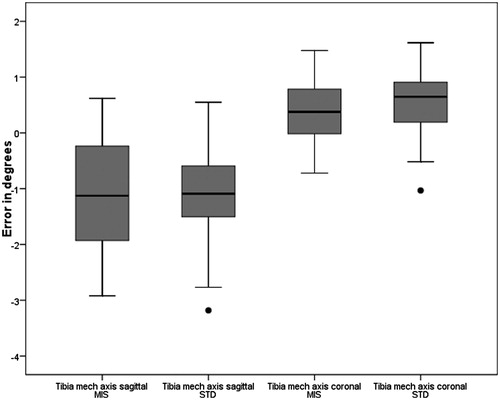
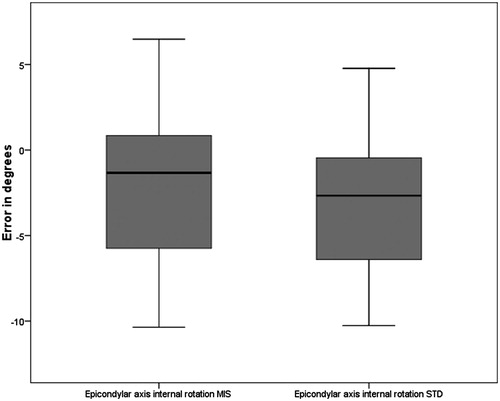
Figure 5. Boxplot of the error in the registration of the epicondyles. •: Outliers between ×1.5 and ×3 the interquartile range. *: p < 0.05. MIS, minimally invasive approach; STD, standard approach.
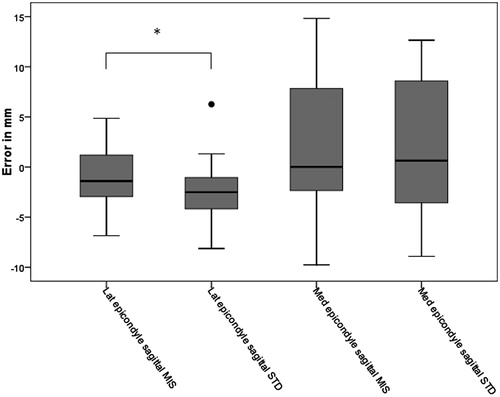
Figure 6. Boxplot of the error in the calculation of the transepicondylar axis. MIS, minimally invasive approach; STD, standard approach.