Figures & data
Figure 1. (A) A coronal CT image and (B) an axial T2-weighted MR image in a patient with a low grade chondrosarcoma involving the anterior column of left acetabulum (red arrows).
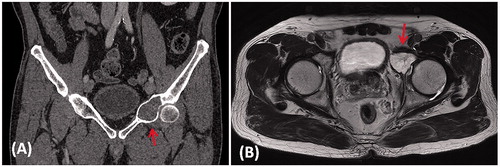
Figure 2. (A) The 3D pelvis was segmented by the thresholding process in the CAD software. The extent of tumor was outlined on each axial CT image and its tumor volume was extracted (red in color). A 3D bone tumor model was created for the surgical planning. (B) Surgeons performed the virtual resections by defining the locations and orientations of the resection planes. The planes were 1 mm in thickness, the same as that of the oscillating saw used during the actual surgery. The footprints at where the PSI was positioned were marked on the bone surface (red and blue lines). The working file of the surgical plan was then sent to the implant engineer for the design of the implant and PSI. (C) The virtually resected tumor was extracted. As the bone was deformed by the tumor, the mirrored 3D image from the normal side of the hemipelvis was used to duplicate the core shape of the implant. (D) The flanges and the acetabular cup were added for better implant stability. The final implant design had a normal acetabular contour and the components for implant fixation.
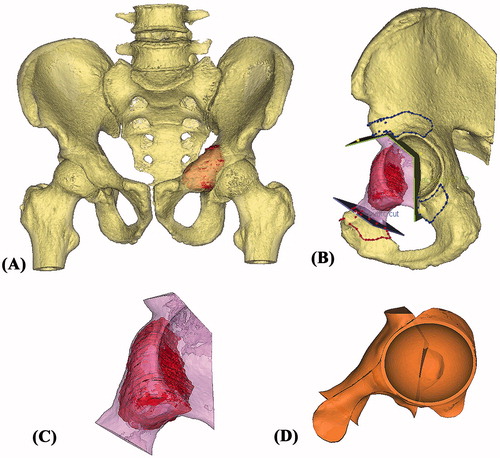
Figure 3. The 3D pelvic model (A: lateral view; B: medial view) showed the implant reconstruction and screws fixation. Screw positions and lengths were planned, based on the bone thickness and quality of the remaining bone after resection. The implant design and the reconstruction were then subjected to FEA evaluation. After the surgeons approved the implant design, the implant was 3D printed as a titanium monoblock. (C) The outer view of the implant showed the solid plate, flanges and the acetabular cup with screws holes for fixation. (D) The back side of the implant showed the porous scaffold that was in contact to the host bone. The scaffold has an interconnected network of pores with an average porosity of 70%. The pores have an average size of 720°μm and the thickness of the solid struts is around 350°μm. This allows the bone to grow inside the construct to achieve a stable biological fixation. The porous construct is also highly resistant to mechanical compression, while its elastic modulus is comparable to that of bone to minimize the risk of the peri-implant stress shielding.
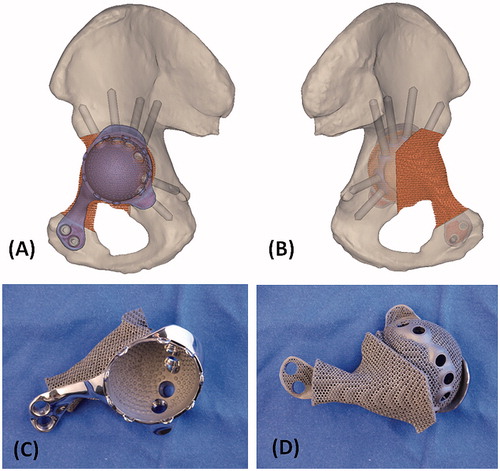
Figure 4. The 3D models of the hemipelvic bone and the implant were further processed to obtain a 3D tetrahedral mesh (3Matic, Materialise NV, Leuven, Belgium) suitable for FEA. A FEM was generated. (A) The lateral view and (B) the medial view of the pelvis with implant reconstruction. The material properties of the implant were assigned to the titanium alloy it is made of. Individualized material properties were assigned to the cortical region and density dependent properties to the trabecular regions of the hemipelvic bone. Starting from the patient’s height and weight, individualized muscle and joint forces were obtained using musculoskeletal modeling. The forces in the muscles (yellow arrows) were applied on the specific regions on the hemi-pelvis that corresponded to the muscles’ attachment regions. The joint force was applied in the newly reconstructed joint surface of the implant. Finally, boundary conditions were defined that fixed the hemi-pelvis at the sacro-iliac joint and pubis symphysis (orange arrows). The FEM simulated the maximal loads that occur on the hip joint during gait motion and the mechanical response of the implant and bone was calculated. (C) The stress distribution showed the design had adequate implant integrity. The bone loading did not cause any bone fracture nor stress shielding. (D) The implant with the block design reconstructing only the bone defect without the additional acetabular cup component was also FEA evaluated after surgery. The result showed a critically high stress pattern in the implant with block design than that of the implant with cup design. It supported the surgeon’s choice of resurfacing the hip joint at the posterior column of the remaining acetabulum.

Figure 5. (A) The design of PSI had the cutting platforms or slits that matched the planned resection planes; the flanges with the contoured shape that allowed a unique PSI positioning on the surgical accessible bone surface decided by the surgeons at the CAD software; and the K-wire holes on the flanges for stabilizing the PSI to the bone. (B) The 3D-printed models included the implant trial, the resected bone tumor together with the removed acetabular bone and the remaining pelvic bone after tumor resection. These models allowed surgeon to rehearse the procedures prior to the real surgery. (C) The 3D-printed tumor PSI. (D) The drill guide on the implant for drilling the screw paths.
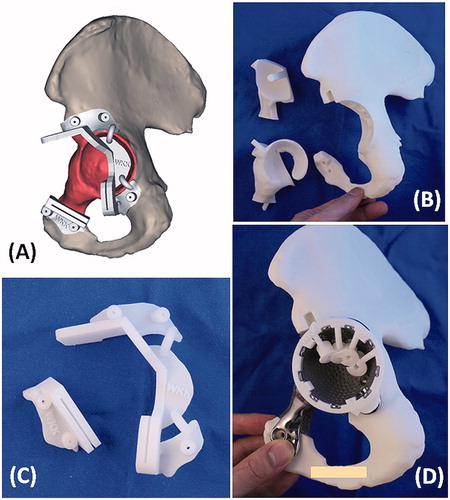
Figure 6. (A) The femoral neurovascular bundles and iliopsoas muscle were protected and retracted medially. The PSI for the acetabular and pubic osteotomies was positioned and secured with K-wires. (B) After PSI-guided tumor resection, the implant was fitted precisely to the bone defect and stabilized with multiple screws fixation as planned. At 10 months after the surgery, the anteroposterior radiograph of the pelvis (C) showed good implant alignment and no evidence of implant loosening. (D) The patient could walk unaided and could achieve single leg standing.
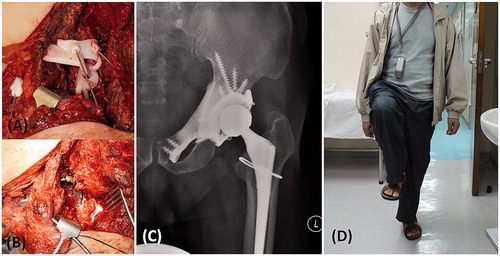
Figure 7. (A) The CT images of the resected tumor specimen (blue in color) were compared with that of the surgical planning (yellow and red in color). The errors of the achieved resections were ranged from 1.3 to 4.0 mm. (B and C) The achieved implant position (blue in color) was comparable with the planned (purple in color). The deviations of achieved cup orientation and position are summarized in .
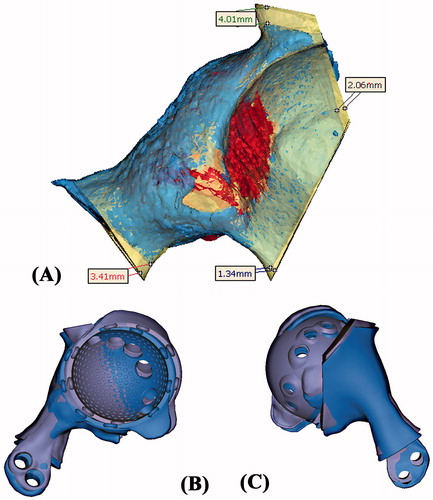
Table 1. The comparison between the achieved implant position and the planned.
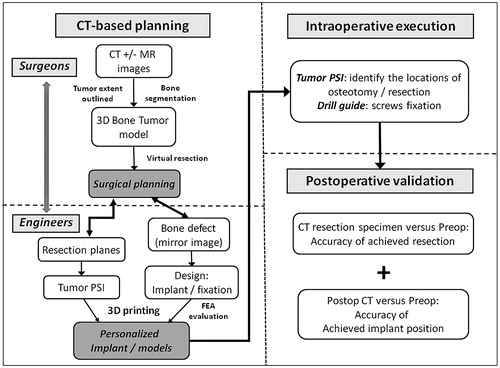
Figure 8. The workflow of using CT-based 3D surgical planning, biomechanically evaluated implant and PSI guided resection and reconstruction in a one-step bone tumor surgery. The workflow requires close collaboration between surgeons and engineers in order to achieve the personalized surgery with sound oncological and biomechanical principles. FEA, finite element analysis; PSI, patient-specific instrument.