Figures & data
Table 1. Baseline patient data.
Table 2. Surgical data of electrode and generator placement.
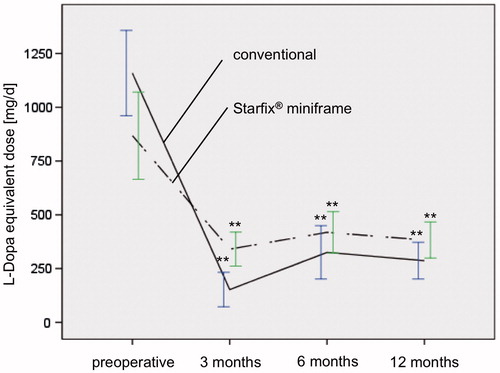
Figure 1. Comparison of LED in both groups showing a significant decrease of dosage in all postoperative time intervals (p ≤ 0.01**).
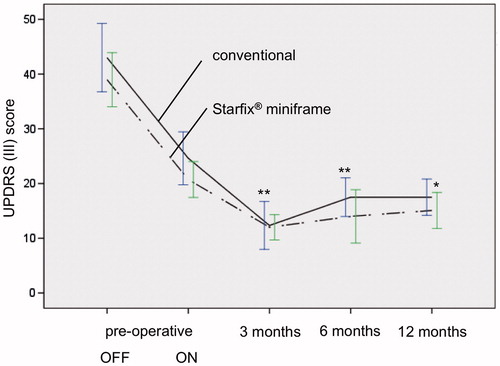
Figure 2. Pre- and postoperative UPDRS in both groups, depending on time course (preoperative, 3, 6 and 12 months after STN-DBS; p ≤ 0.01**; p ≤ 0.05*). Improvement of motor functionality is comparable in conventional stereotactic group (group I) and Starfix® miniframe group (group II).
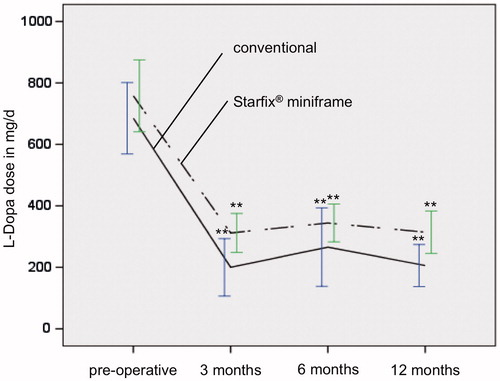
Figure 3. Reduction in L-Dopa dose in both groups is significant (p ≤ 0.01**) in the postoperative course 3, 6 and 12 months after DBS compared to initial preoperative L-Dopa dose. postop, postoperatively.