Figures & data
Figure 1. Manual improvement of the liver surface segmentation result by moving the control point (left); selection of the right wall of the cube allows movement to curve in the corresponding spatial direction (bottom left corner in the same picture); the liver vessel model represented as a set of central lines (right-up); control points for the selected curve for manual correction of the spatial position (right-down).
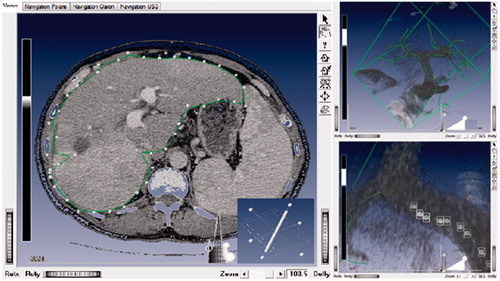
Figure 2. Focal liver lesion – volumetric presentation (left) and abdominal surface of the patient with markers (red) and selected entry point (yellow) (right).
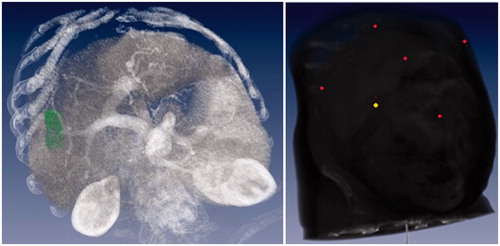
Figure 3. Integrated marker photo (left); marker construction (right): part visible on CT (1), part visible to the video metric tracking system (2), and the adhesive element (3).
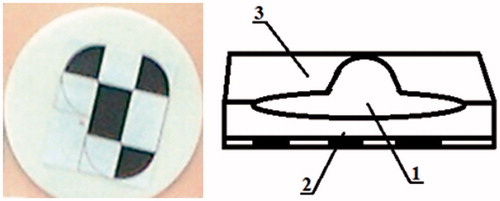
Figure 4. With markers attached (right) that are visible on CT images (left), with nine markers attached to the patient.[Citation10].
![Figure 4. With markers attached (right) that are visible on CT images (left), with nine markers attached to the patient.[Citation10].](/cms/asset/7003fbe8-469b-4261-b500-c5fbfaa9f46a/icsu_a_1076043_f0004_c.jpg)
Figure 5. The time course of marker relative position (mm), breathing phase (normalized value) and FRE (mm) for a selected patient.
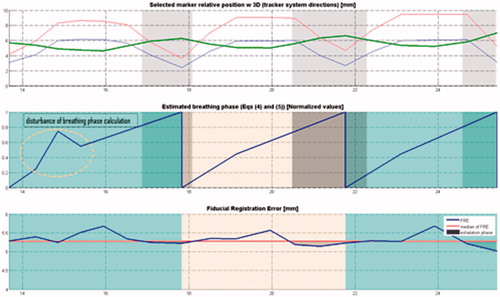
Figure 6. Correlations between the US sequences and 4DCT images: main scores of PCA analysis for the US sequence (a) and the 4DCT sequence (e), Hilbert transform phase signal for the US sequence (b) and the 4DCT sequence (d), and 4DCT phase corresponding to each US frame (c).
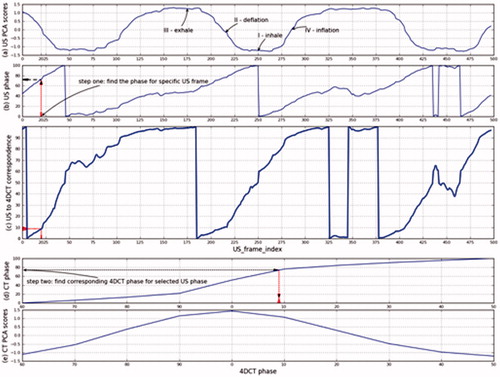
Figure 7. US image (left), slice of the 4DCT data at the corresponding respiratory phase and section plane (middle) and fusion with US in a color overlay (right). Rows denote four different time steps: inhalation ( – I), deflation ( – II), exhalation ( – III) and inflation ( – IV).
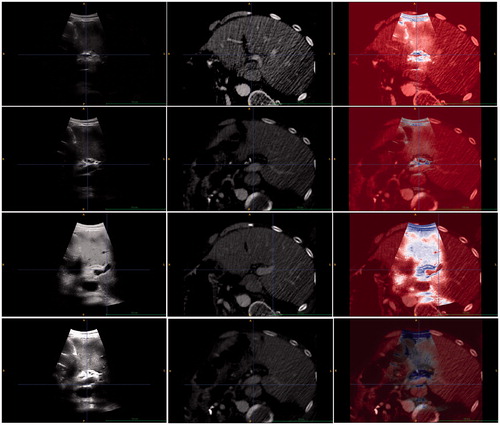
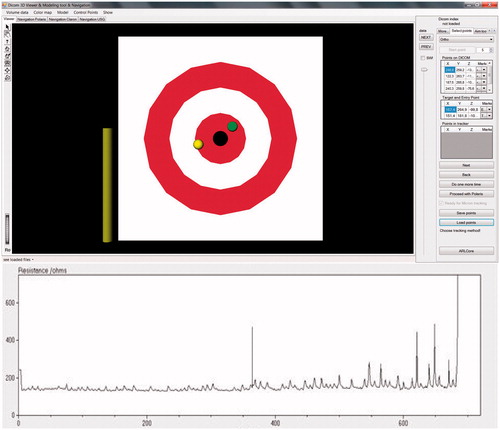
Figure 8. The graphical user interface supported needle insertion (up); tissue resistance during swine RFA liver ablation from Olympus Celon device (bottom).