Figures & data
Figure 1. The joint component gap was measured manually as guided by a navigation system. Photograph (A) and screen shot (B) show varus stress at 120°. Photograph (C) and screen shot (D) show valgus stress at 120°. Screen shots show 1° varus in varus stress (B) and 3° valgus in valgus stress (D); thus medio-lateral laxity (soft tissue balance) was calculated as 4°.
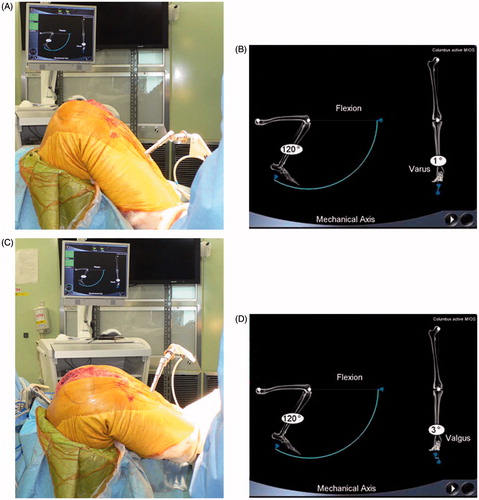
Figure 2. Correlation between post-operative knee flexion angle and (A) pre-operative flexion angle (R = 0.794, p < 0.001), and (B) intra-operative flexion angle (R = 0.424, p = 0.020).
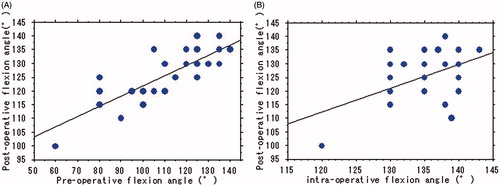
Figure 3. Intra-operative medio-lateral laxity in posterior-stabilized TKA at 0°, 90°, 120°, and maximum of flexion. All results are expressed as the mean ± standard deviation.
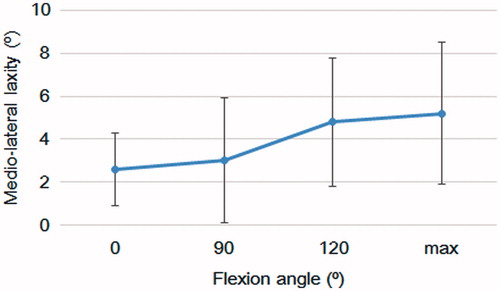
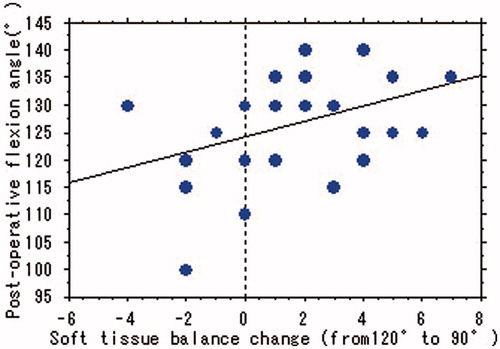
Figure 4. Correlation between post-operative knee flexion angle and change in soft tissue balance (medio-lateral laxity, from 120° to 90°, R = 0.414, p = 0.023).