Figures & data
Table 1. Primer sequences for forward and reverse probes used in qPCR.
Figure 1. Anakinra prevents TTR deposition in the sciatic nerve and does not alter TTR expression by the liver. (A) Representative pictures of TTR load in sciatic nerve and DRG of Hsf/V30M mice treated with Anakinra (right panels, n = 10) and age-matched controls (left panels, n = 10). Scale bar 50 µm. Charts represent the quantification of immunohistochemical images, and data represent mean ± SEM (*p < 0.05). (B). Histogram represents TTR mRNA levels in the liver of Anakinra-treated mice (n = 10), as compared with controls (n = 10). Gapdh was the housekeeping gene for normalization. Data represent mean ± SEM.
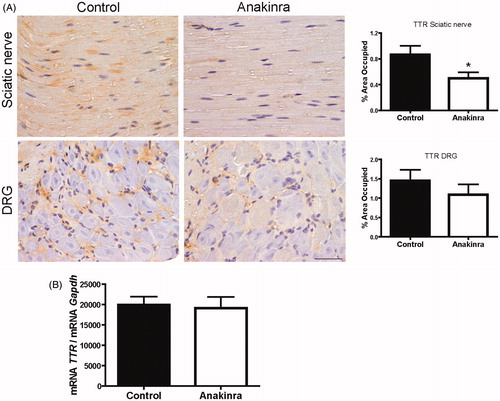
Figure 2. Anakinra prevents neurodegeneration in the Hsf/V30M FAP mouse model. Morphometric analyses of sciatic nerve segments in Anakinra-treated and control animals. (A) Fiber density assessed in semithin sections showing no impact of IL-1 blocking on myelinated fibers. Scale bar: 50 µm, n = 6 animals within each group. (B) Electron microscopy representative images, and correspondent chart, indicating higher unmyelinated fiber density in Anakinra-treated animals, as compared to controls. Scale bar: 2 µm, n = 6 animals per group (*p < 0.05).
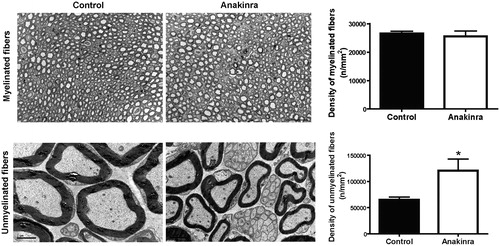
Figure 3. Expression of IL-1 signaling pathway mediators and evaluation of NF-κB activation throughout p65 subunit translocation to the nucleus. (A) Downregulation of pro-inflammatory mediators expression in DRG of Anakinra-treated animals (n = 7), as compared to controls (n = 7), evaluated by qPCR (*p < 0.05). Normalization was performed against Gapdh mRNA. No impact of Anakinra was observed regarding Tnf-α expression. (B) IL-1β protein levels in the peripheral nervous system assessed by SQ-IHC (n = 10 per group), with respective semi-quantification (presented as mean ± SEM; ***p < 0.001; *p < 0.05), demonstrating lower immunostaining in Anakinra-treated mice in both nerve and DRG. Scale bar 50 µm. (C) Representative SQ-IHC pictures of p65 NF-κB subunit in sciatic nerve of mice treated with Anakinra as compared to age-matched controls (n = 10 in each group). Mice treated with Anakinra presented lower p65 nuclear staining as compared with controls (arrows), suggesting a reduction in p65 nucleus translocation. Scale bar 50 µm. Chart shows quantification of immunohistochemical images, and data represent mean ± SEM (**p < 0.01).
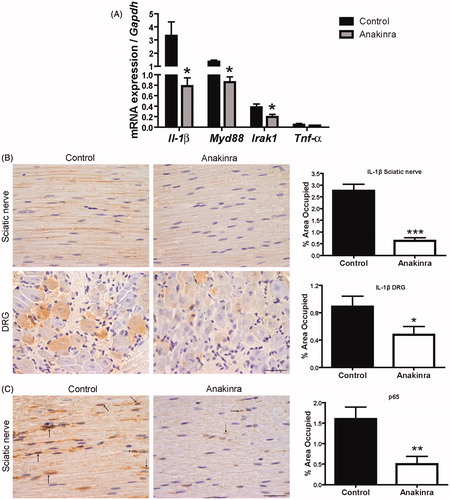
Figure 4. Anakinra suppresses apoptotic cell death in the peripheral nervous system and reduces expression of Hsp-27. (A) Representative SQ-IHC images of Fas death receptor in the peripheral nervous system and respective quantifications (n = 10 per group), demonstrating lower levels of Fas in treated animals. Data represent mean ± SEM (***p < 0.001). (B) Cleaved caspase-3 immunostaining in sciatic nerve and DRG of Hsf/V30M mice treated with Anakinra (right panels, n = 10) and age-matched controls (left panels, n = 10). Scale bar 50 µm. Charts characterize the quantification of immunohistochemical images, and data represent mean ± SEM (**p < 0.01 and ***p < 0.001). (C) Inhibition of Hsp-27 mRNA levels in DRG of Anakinra-treated mice as compared with controls (n = 7 of each group). The relative mRNA expression was normalized to Gapdh (***p < 0.001).
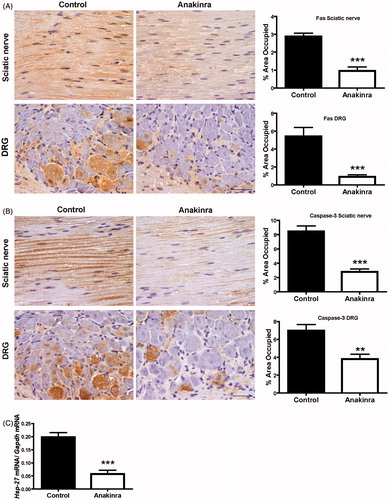
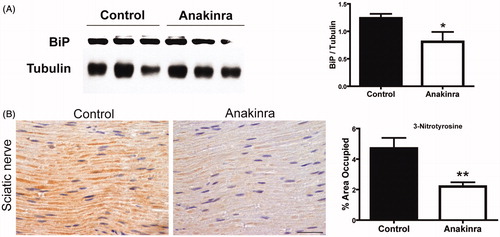
Figure 5. Anakinra reduced ER and nitrative stress. (A) Western blot quantification of BiP in DRG from mice treated with Anakinra (n = 7) and non-treated age-matched controls (n = 7). Histogram denotes normalized BiP/Tubulin density quantification ± SEM (*p < 0.05). (B) Representative SQ-IHC pictures of 3-nitrotyrosine in sciatic nerve of mice treated with Anakinra (right panel, n = 10) and age-matched controls (left panel, n = 10). Scale bar 50 µm. Chart represents the quantification of immunohistochemical images, and data represent mean ± SEM (**p < 0.01).