Figures & data
Figure 1. Characterization of liver tissue scaffolds. (A) Macroscopic appearance before and after the decellularization procedure of native healthy (H-mL), amyloidotic (AA-mL), decellularized healthy (H-mLdec) and amyloidotic (AA-mLdec). (B) Sections stained with H&E. (C) DNA quantification of mouse livers to show reduction of DNA after decellularization confirming removal of cells. (D) Sections stained with SR. (E) Elastin Van Gieson staining of mouse livers sections shows preservation of collagen and elastin after decellularization. Scale bar for 40× magnification: 50 µm.
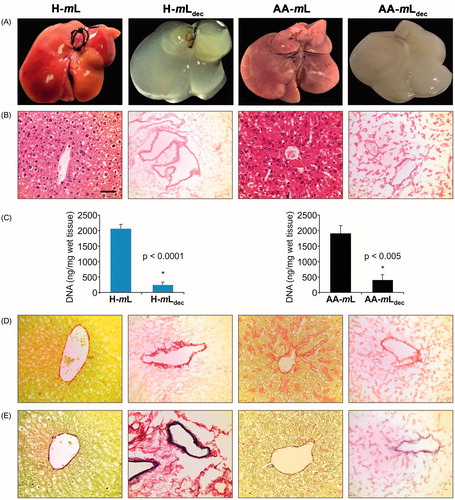
Figure 2. Amyloid in decellularized amyloidotic mouse liver. (A, B) Decellularized liver scaffold from a heavily amyloidotic mouse was stained by immunohistochemistry for SAA and with Congo red, and viewed under bright field illumination A and with crossed polarizers B respectively. (C) No primary antibody control for A. (D, E) Intact liver from an SAA expressing amyloidotic mouse stained for SAA and with Congo red and viewed under bright field, D, and crossed polarized light, E, showing amyloid in portal tracts. In addition, nascent SAA within the cytoplasm of hepatocytes gave strong immunohistochemical signal. (F) No primary antibody control for intact liver. (G, H) Decellularized healthy mouse liver did not stain with SAA antibody or Congo red viewed under bright field (G) or cross polarized light (H). (I) no primary antibody control for decellularized healthy mouse liver. (J, K) SEM images of native normal and amyloidotic livers respectively. (L, M) SEM images of decellularized healthy and amyloidotic liver, respectively. Scale bar 200 µm, A–I; 2 µm, J–K, and 10 µm, L–M.
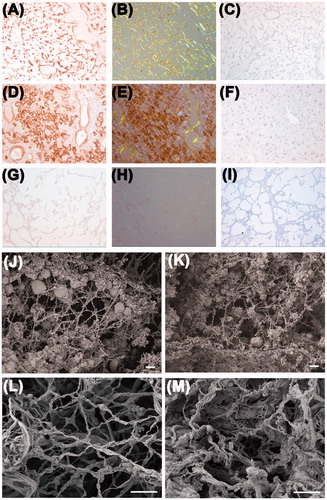
Figure 3. Characterization of AA mouse livers homogenates. (A) Total 2 µg of homogenates from AA-mL (lane i) and AA-mLdec (lane ii) were separated in SDS 15% PAGE under reducing conditions. Apparent molecular weights for the marker are given in kDa. 1 and 2 indicate bands subjected to mass mapping analysis. (B) Tryptic peptides obtained by digestion of SDS-PAGE bands were analyzed by MALDI-MS. MH+ monoisotopic values (Da) are reported for each peptide. (C) Western blot analysis of AA-mL (i) and AA-mLdec (ii) and standard serum mouse SAA1 (11.6 kDa) from the same strain of double transgenic mice [Citation12] as AA-mL and AA-mLdec.
![Figure 3. Characterization of AA mouse livers homogenates. (A) Total 2 µg of homogenates from AA-mL (lane i) and AA-mLdec (lane ii) were separated in SDS 15% PAGE under reducing conditions. Apparent molecular weights for the marker are given in kDa. 1 and 2 indicate bands subjected to mass mapping analysis. (B) Tryptic peptides obtained by digestion of SDS-PAGE bands were analyzed by MALDI-MS. MH+ monoisotopic values (Da) are reported for each peptide. (C) Western blot analysis of AA-mL (i) and AA-mLdec (ii) and standard serum mouse SAA1 (11.6 kDa) from the same strain of double transgenic mice [Citation12] as AA-mL and AA-mLdec.](/cms/asset/260e96f0-c6e2-4b3e-9cc5-d2ba000fe119/iamy_a_1110518_f0003_b.jpg)
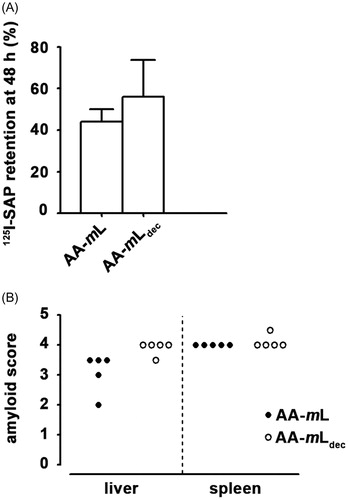
Figure 4. AA-mLdec contains amyloid enhancing factor activity. (A) Amyloid, induced in groups of five C57BL/6 mice with homogenates of AA-mLdec or AA-mL followed by repeated subcutaneous casein injections, was quantified by whole-body retention of 125I-SAP as percentage of the injected dose. (B) Histological grading of amyloid in both the spleen and the liver are shown.