Figures & data
Table 1. Antibodies used for immunohistochemistry.
Figure 1. Generation of conformation-specific mis-TTR mAbs. (A) The amino acid sequence of human TTR highlighting the location of the mis-TTR epitope (residues 89–97, red). (B) Location of the mis-TTR epitope (red), which is inaccessible to mis-TTR mAb binding due to its location within the tetramer (left), but is exposed in the dissociated monomer (right). (C) The primary sandwich ELISA screening assay identified four clones that reacted strongly against pH4-TTR (light gray bars) and with minimal reactivity toward native, tetrameric TTR (dark gray bars).
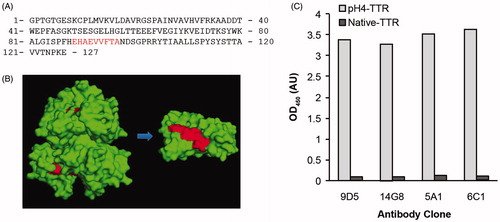
Figure 2. Characterization of mis-TTR mAbs by Western blot analysis. (A) Native TTR (TTR) and pH4-TTR (F) were separated by non-denaturing SDS-PAGE and stained with instant blue or Western blotted with mis-TTR mAbs. Under these PAGE conditions, native TTR migrated as primarily an ∼38 kDa native dimer (ND) with a minor amount of ∼60 kDa tetramer (T). pH4-TTR migrated as an ∼15 kDa monomer (M) and a ∼32 kDa non-native dimer (D). All four mis-TTR mAbs showed immunoreactivity toward the non-native TTR monomer and dimer, but did not react with native TTR. (B) In contrast, the total TTR mAbs, 8C3 and the Sigma pAb did not discriminate between TTR species. (C) By native-PAGE/Western, native TTR migrated as a tetramer (T) and a higher molecular weight native oligomer (O) while pH4-TTR (F), composed of aggregated forms of TTR, migrated as a high molecular weight smear ranging in size from ∼66–720 kDa. All four mis-TTR mAbs strongly recognized this high molecular weight TTR smear but did not react with the native tetramer or native oligomer. In contrast, the Sigma pAb reacted with all TTR species and did not show any conformational specificity.
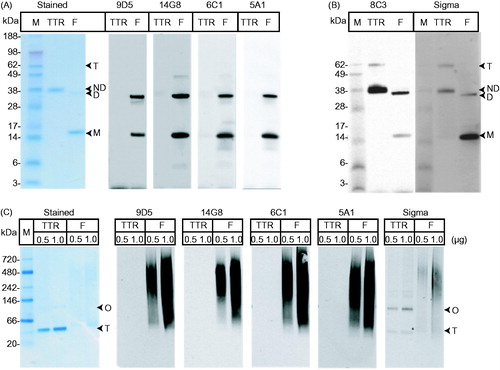
Table 2. Kinetic parameters for binding of mis-TTR antibodies to TTR-F87M/L110M determined by SPR.
Figure 3. Inhibition of TTR-V122I fibril formation by mis-TTR mAbs. (A) TTR fibril formation (induced by incubation of TTR-V122I at pH 4.8 for 72 h and assessed by end-point thioflavin-T (ThT) fluorescence) was inhibited in the presence of 0–0.2 mg/mL 14G8 mis-TTR mAb (filled circles). Antibody alone (open circles) exhibited very little ThT binding and fluorescence. (B) In contrast to 14G8, the isotype control antibody, EG27/1, did not inhibit TTR fibril formation as demonstrated by no reduction in ThT fluorescence intensity.
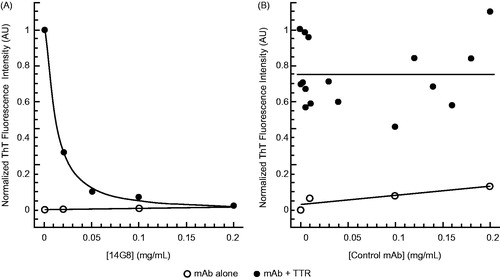
Table 3. Inhibition of TTR-V122I fibril formation by mis-TTR antibodies (n=3 assays/antibody).
Figure 4. mis-TTR mAb-dependent phagocytosis. (A) TTR-F87M/L110M or native TTR was covalently labeled with the pH-sensitive fluorescent dye, pHrodo, which shows enhanced fluorescence upon exposure to lowered pH in endocytic vesicles. Uptake of the pHrodo label as measured by relative mean fluorescence intensity (MFI) of THP-1 cells was specific for pHrodo-TTR-F87M/L110 that was treated with 14G8 (gray bars), but not an isotype control antibody (black bars). 14G8 had no effect on the uptake of native pHrodo-TTR. Data are presented as mean ± SEM (n=3). (B) All four anti-mis-TTR antibodies increased uptake of aggregated pHrodo-ATTR V30M in a dose-dependent fashion as measured by pHrodo-positive THP-1 cells. In contrast, no uptake was observed in cells treated with an isotype control IgG and no fluorescence was detected in untreated cells (red circle). (C) Representative 20× objective pHrodo 594 brightfield overlays of THP-1 cells showing uptake of aggregated pHrodo-TTR-V30M in the presence of mis-TTR antibodies (most intensely fluorescent pHrodo-positive THP-1 cells denoted with white arrows).
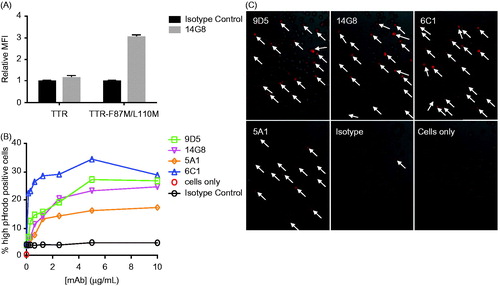
Figure 5. 14G8 specifically identifies amyloidogenic TTR deposits in human ATTR amyloidosis cardiac tissue. Immunohistochemical labeling of cardiac tissue derived from an ATTR amyloidosis patient harboring the I84S mutation. (A) 14G8 mis-TTR mAb and (B) total-TTR pAb (DAKO) immunoreactivities were overlapping and identified comparable deposits in the myocardium and vasculature that were not immunoreactive for anti-6F10 (C), an isotype control. Lower-intensity immunohistochemical labeling with 14G8 (black arrows, A) was found in regions not staining for amyloid, and thus may represent pre-amyloidogenic TTR deposits. These same deposits were also labeled by thioflavin T (D) and Congo red (E), which confirmed the amyloid nature of these deposits. Congo red birefringence (F) aligned with the same areas showing the greatest amount of TTR deposits. Scale bar = 500 μm.
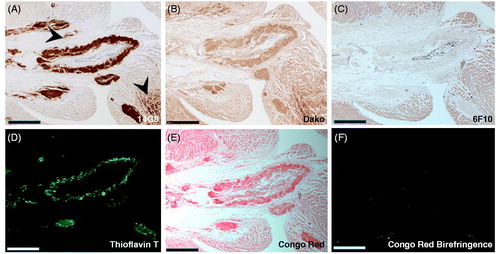
Figure 6. 14G8 immunolabels cardiac tissue from patients with hereditary and sporadic ATTR amyloidosis cardiomyopathy. (A) 14G8 strongly immunolabeled TTR deposits in diseased ATTR amyloidosis heart tissue derived from patients with familial (V122I, T60A, T49A, I84S) and wild-type forms of cardiac ATTR amyloidosis. (B) No 14G8 immunolabeling was observed in cardiac tissue from healthy individuals (Normal) or from cardiomyopathy patients with non-related AL amyloidosis (AL). Scale bar = 500 μm.
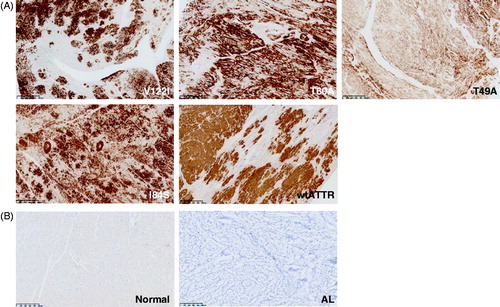
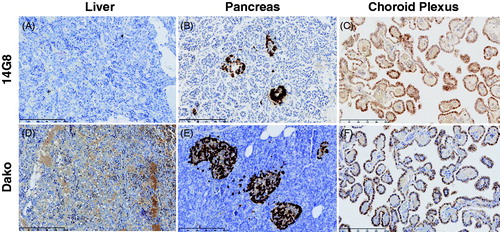
Figure 7. Staining of TTR by the 14G8 mis-TTR mAb in normal tissue known to express TTR. 14G8 did not stain the TTR present in normal human liver (A) but did stain intracellular TTR present in normal pancreatic α-cells (B) and choroid plexus (C) from normal donors. Staining of tissue with 14G8 was specific as demonstrated by the lack of staining in adjacent sections using an isotype control antibody (data not shown). This is in contrast to staining of TTR using the Dako antibody which stained total TTR present in all three of these normal tissue types (D–F). Scale bar = 250 μm.